


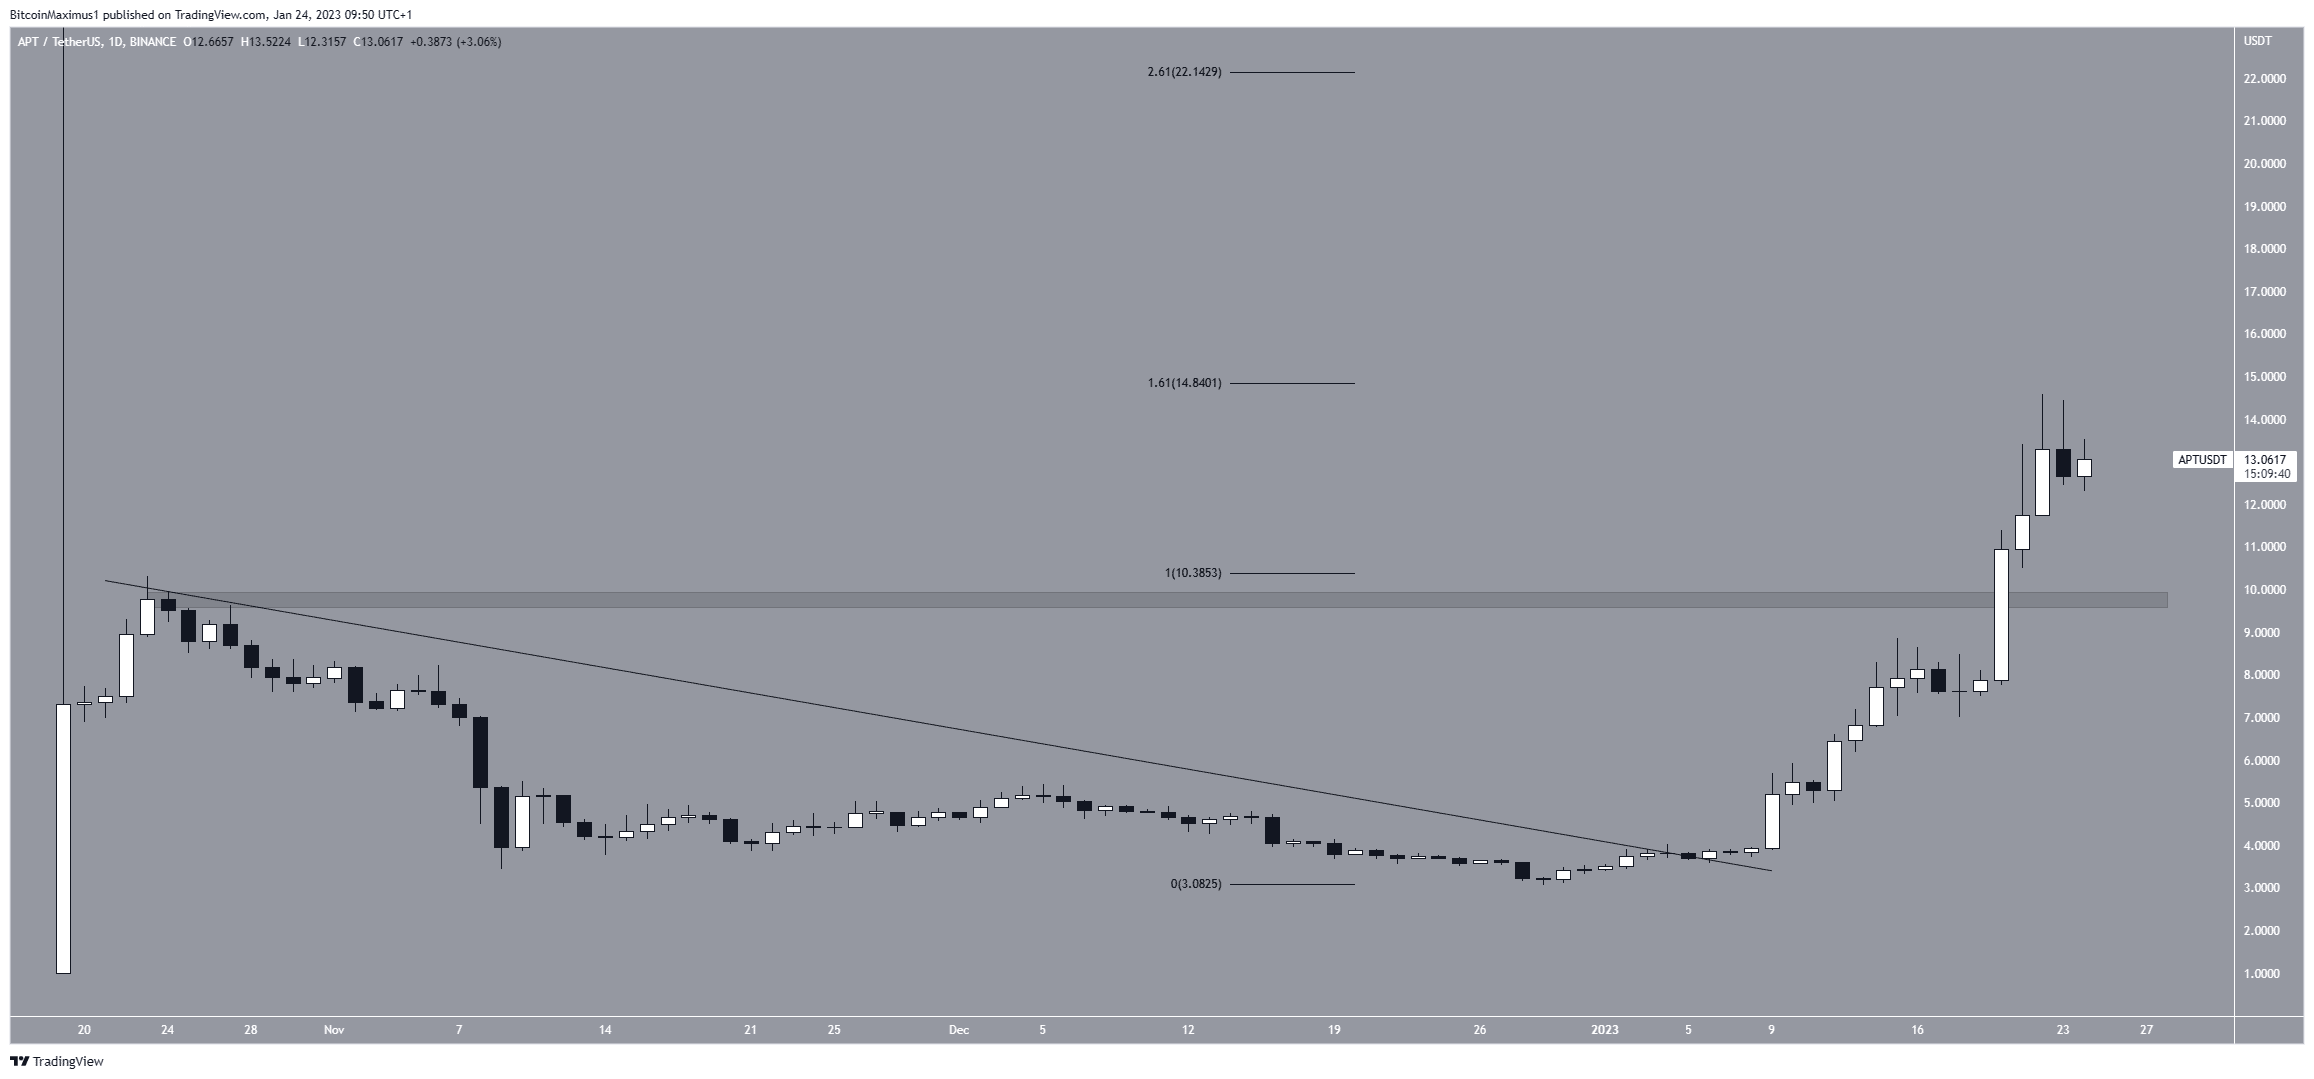
The Aptos (APT) price reached a new all-time high on Jan. 22 but could decrease substantially before continuing its upward movement. On Jan. 6, the APT price broke out from a descending resistance line. At the time, it was trading just above its minimum price of $3.06. It has increased at an accelerated rate since […]
The Aptos (APT) price reached a new all-time high on Jan. 22 but could decrease substantially before continuing its upward movement.
On Jan. 6, the APT price broke out from a descending resistance line. At the time, it was trading just above its minimum price of $3.06. It has increased at an accelerated rate since and broke out from the $9.80 resistance area on Jan. 20. Two days later, it reached a new all-time high of $14.57. However, the price has created two long upper wicks over the past 24 hours. These are considered signs of selling pressure.
Since the price is at an all-time high, the use of Fib retracement levels is required to determine the next resistance. The first resistance is at $14.84, the 1.61 external retracement of the entire previous drop. If the price breaks out, the next resistance would be at $22.15, the 2.61 external retracement level.
On the other hand, a rejection could lead to a re-test of the $9.80 area.
While the daily RSI is overbought, it has not generated any bearish divergence yet. Therefore, due to the mixed readings between the price action and indicators, a closer look at the movement is required in order to determine the Aptos crypto future trend.
Aptos Price Prediction for Feb
A closer look at the upward movement shows that the APT price is likely in the fifth and final wave of an upward movement. After the move is completed, a substantial correction would be expected. If so, the 0.5-0.618 Fib retracement support area (white) at $7.45 – $8.80 would be likely to provide support.
Also, wave five has the same length as waves one and three combined, which is common when wave five extends. This is another sign of a potential Aptos crypto top. The correction outline is also supported by the six-hour RSI, which has generated bearish divergence (green line).
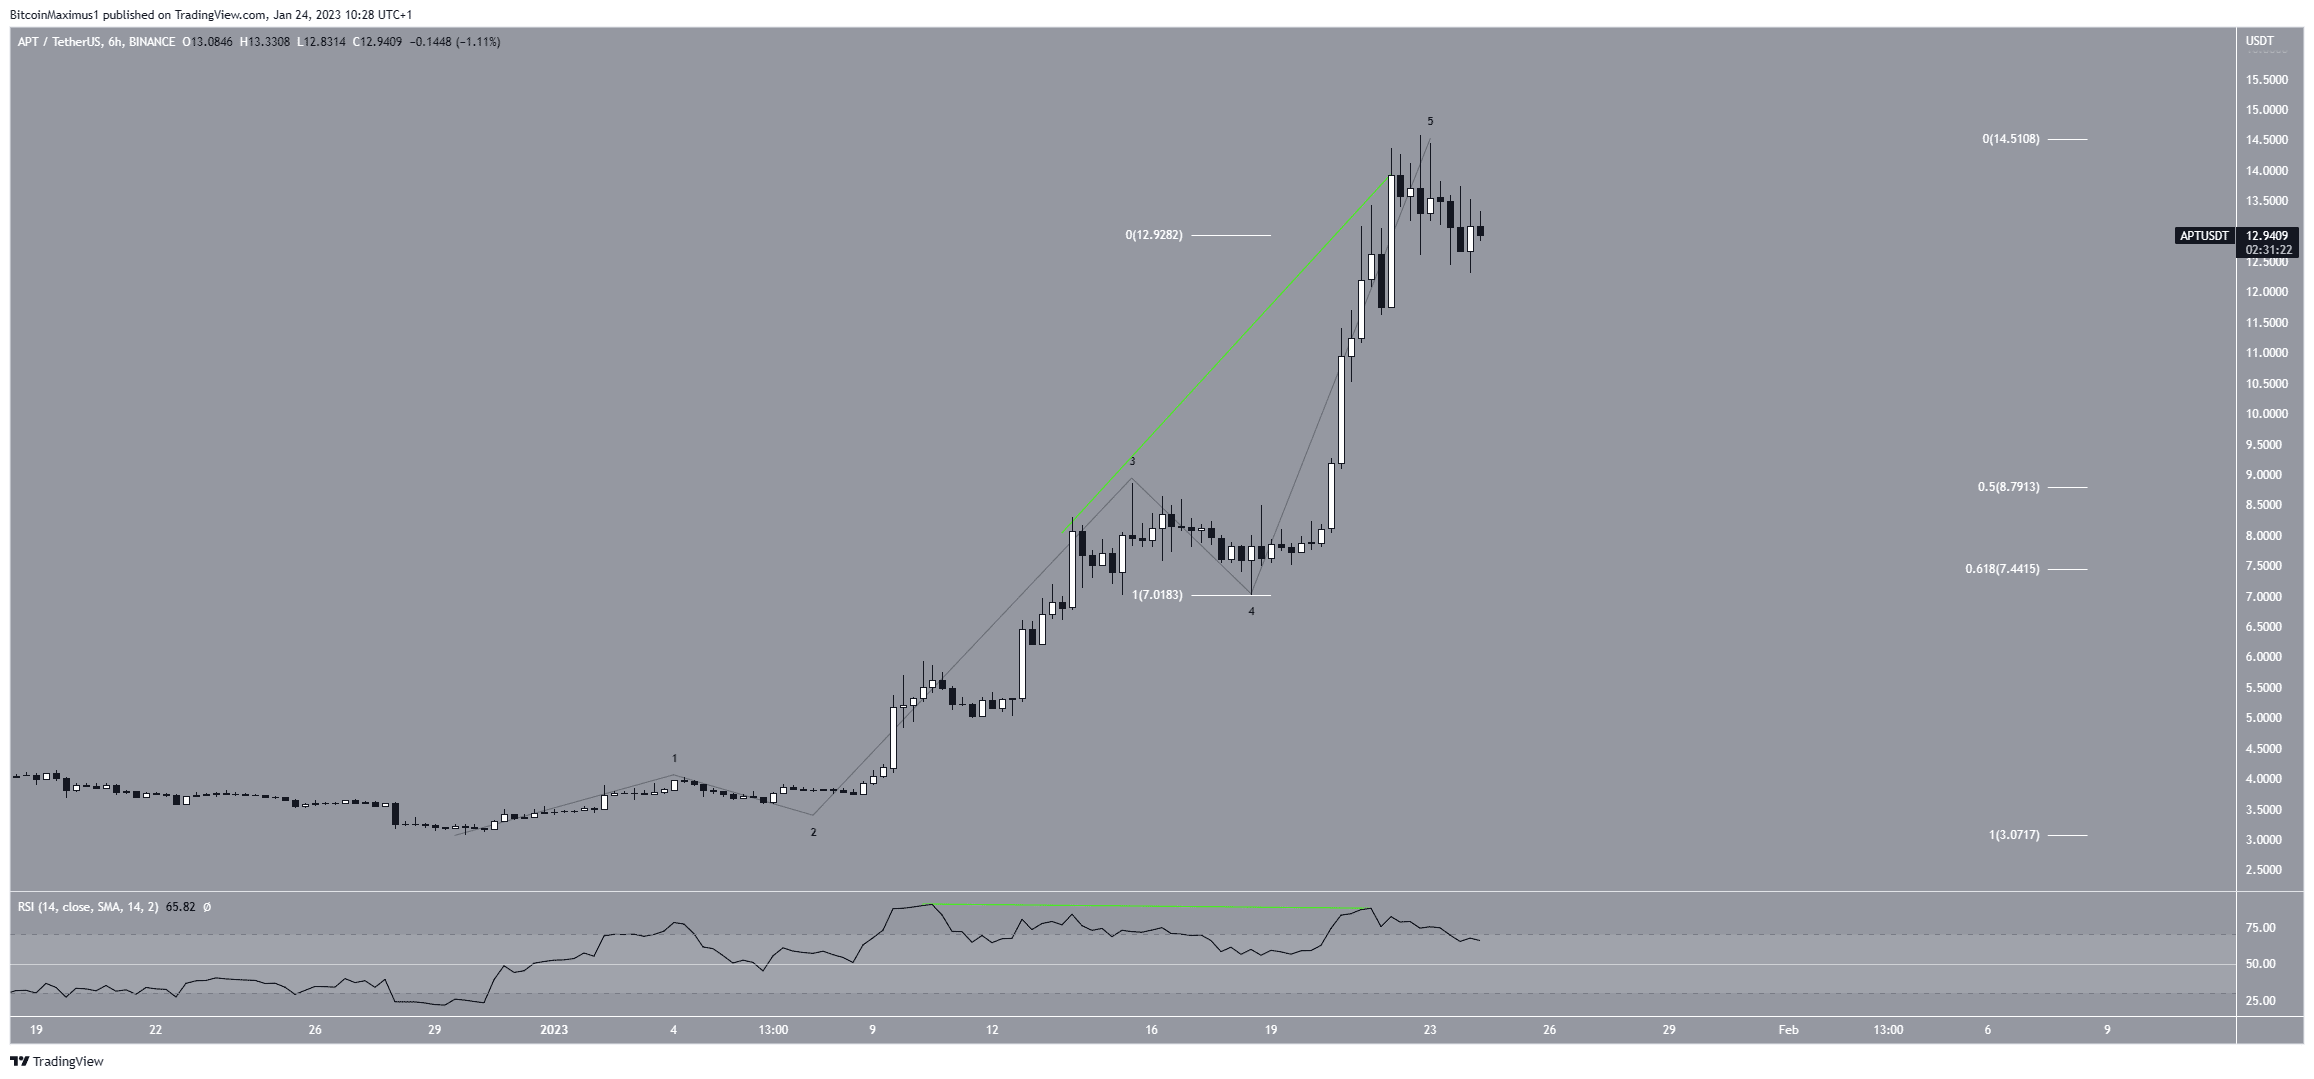
To conclude, the most likely Aptos price prediction for Feb. is a correction toward $7.45-$8.80. A substantial increase above $14.85 would invalidate this bearish APT price analysis and indicate that an upward movement toward $22.15 is likely.
For BeInCrypto’s latest crypto market analysis, click here.
The post Aptos (APT) Price Shows No Signs of Slowing Down Despite Hitting New All-Time High appeared first on BeInCrypto.


