


Bitcoin price started a fresh increase from the $18,750 zone against the US Dollar. The price is now trading above $20,000 and the 55 simple moving average (4-hours). There is a key bullish trend line forming with support near $20,950 on the 4-hours chart of the BTC/USD pair (data feed from Coinbase). The pair could […]
- Bitcoin price started a fresh increase from the $18,750 zone against the US Dollar.
- The price is now trading above $20,000 and the 55 simple moving average (4-hours).
- There is a key bullish trend line forming with support near $20,950 on the 4-hours chart of the BTC/USD pair (data feed from Coinbase).
- The pair could continue to move up if it stays above the $20,000 resistance zone.
Bitcoin price is rising above $20,000 against the US Dollar. BTC might extend gains if there is a clear move above the $21,500 resistance zone.
Bitcoin Price Analysis
Bitcoin price started a fresh increase from the $18,750 support zone. A base was formed and the price climbed higher above the $19,500 resistance zone.
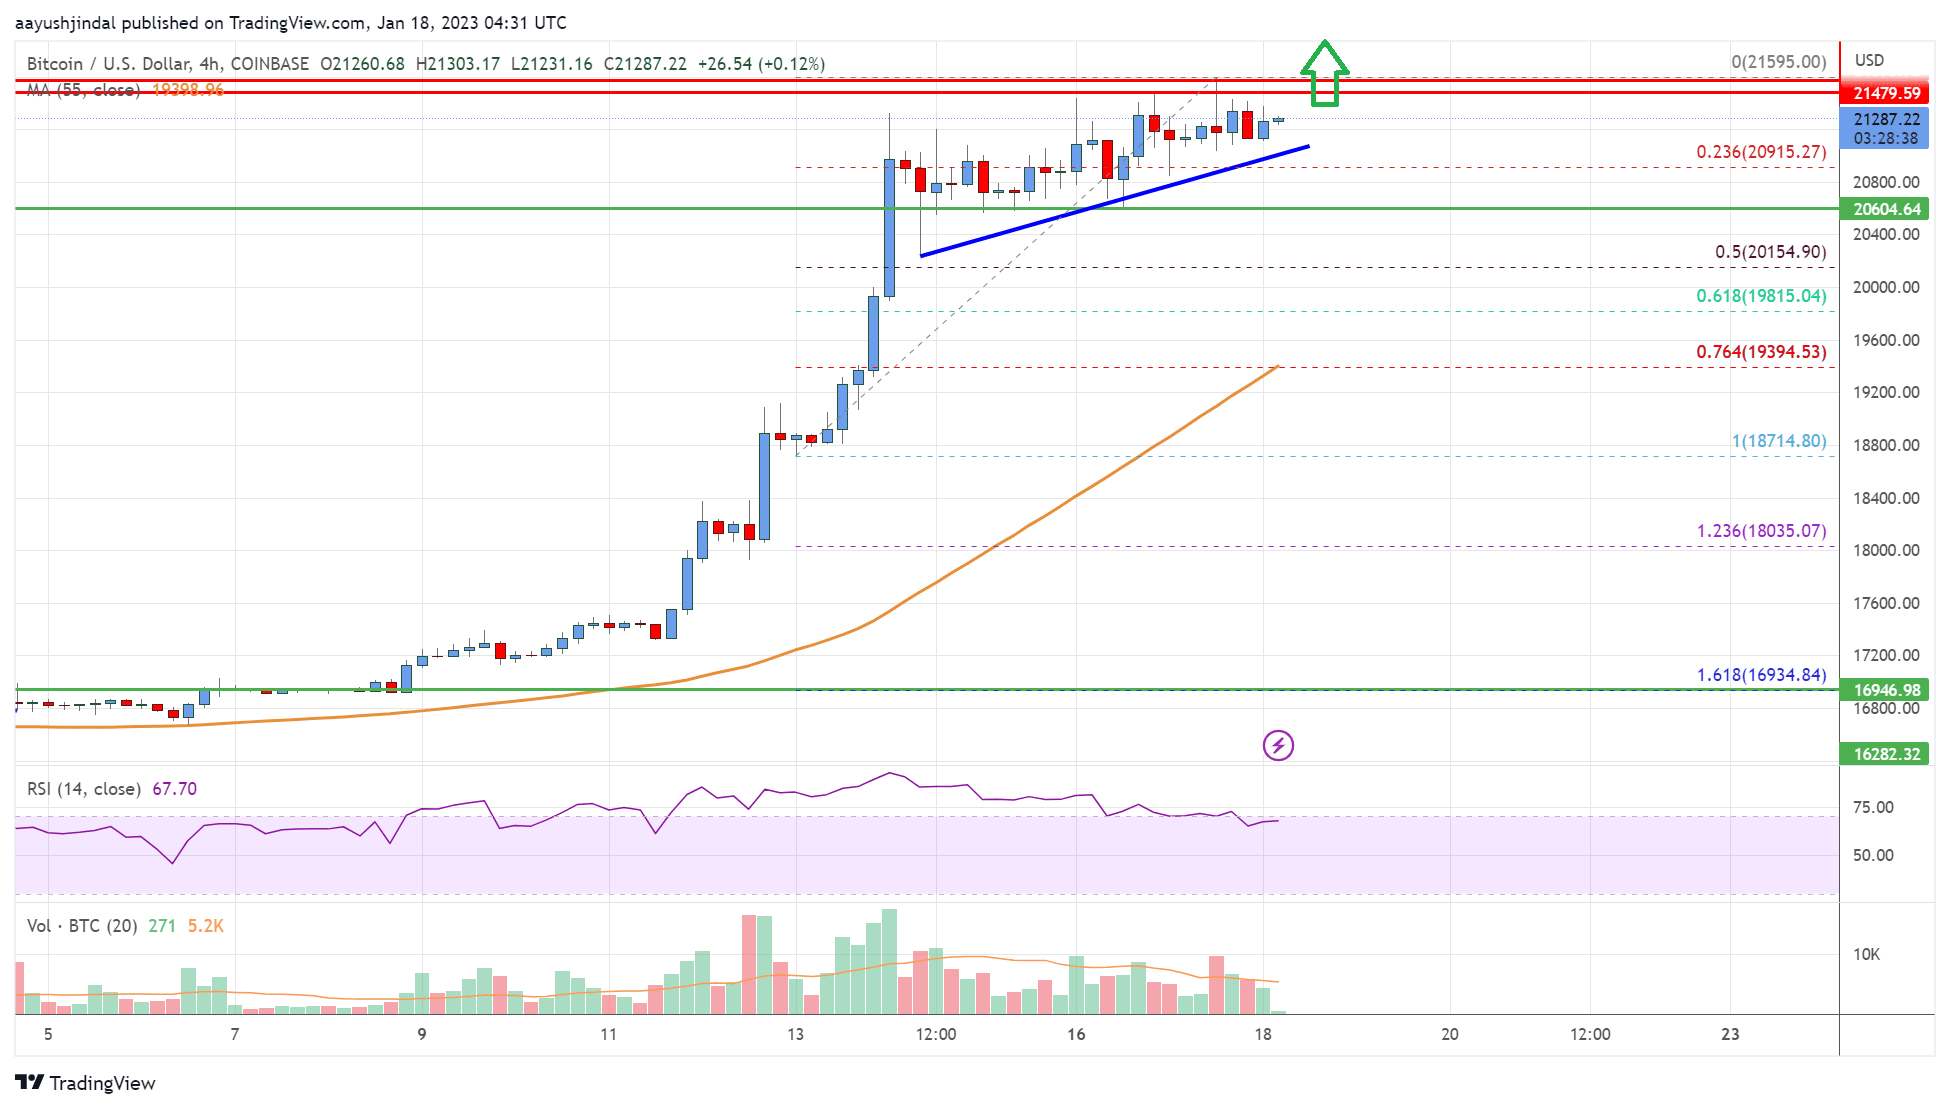
The bulls pushed the price above the $20,000 resistance and the 55 simple moving average (4-hours). The upward move was such that the price climbed towards the $21,500 resistance zone. A high is formed near $21,595 and the price is now consolidating gains.
It is now trading above $20,000 and the 55 simple moving average (4-hours). There is also a key bullish trend line forming with support near $20,950 on the 4-hours chart of the BTC/USD pair.
An immediate resistance on the upside is near the $21,500 level. The next major resistance might near the $22,000 zone. The first major resistance is near the $22,500 level. A clear move above the $22,500 level might send the price towards $24,000, above which the price might rise towards the $25,000 level.
Any more gains might push the price towards the $26,200 zone. If there is no upside break, the price might decline below the $21,000 level. The first major support is near $20,900 or the 23.6% Fib retracement level of the upward move from the $18,714 swing low to $21,595 high.
The next key support is near the $20,500 level. It is close to the 50% Fib retracement level of the upward move from the $18,714 swing low to $21,595 high, below which the price might accelerate lower.
In the stated case, the price could decline towards the $19,450 level. Any more losses might send the price towards the $18,000 level.
Looking at the chart, bitcoin price is clearly trading above $20,000 and the 55 simple moving average (4-hours). Overall, the price could continue to move up if it stays above the $20,000 resistance zone.
Technical Indicators
4 hours MACD – The MACD is now gaining momentum in the bullish zone.
4 hours RSI (Relative Strength Index) – The RSI is now above the 50 level.
Key Support Levels – $20,900 and $20,500.
Key Resistance Levels – $21,500, $22,000 and $22,500.
The post Bitcoin Price Analysis: BTC Rally Could Extend Above $22K appeared first on Live Bitcoin News.


