


The Chainlink (LINK) price is trading inside a crucial Fib and horizontal support level. Whether it bounces or breaks down could determine the future trend’s direction. The Chainlink price had increased alongside an ascending support line since the beginning of the year, when it deviated below the $5.75 horizontal support area (red circle). The increase led […]
The Chainlink (LINK) price is trading inside a crucial Fib and horizontal support level. Whether it bounces or breaks down could determine the future trend’s direction.
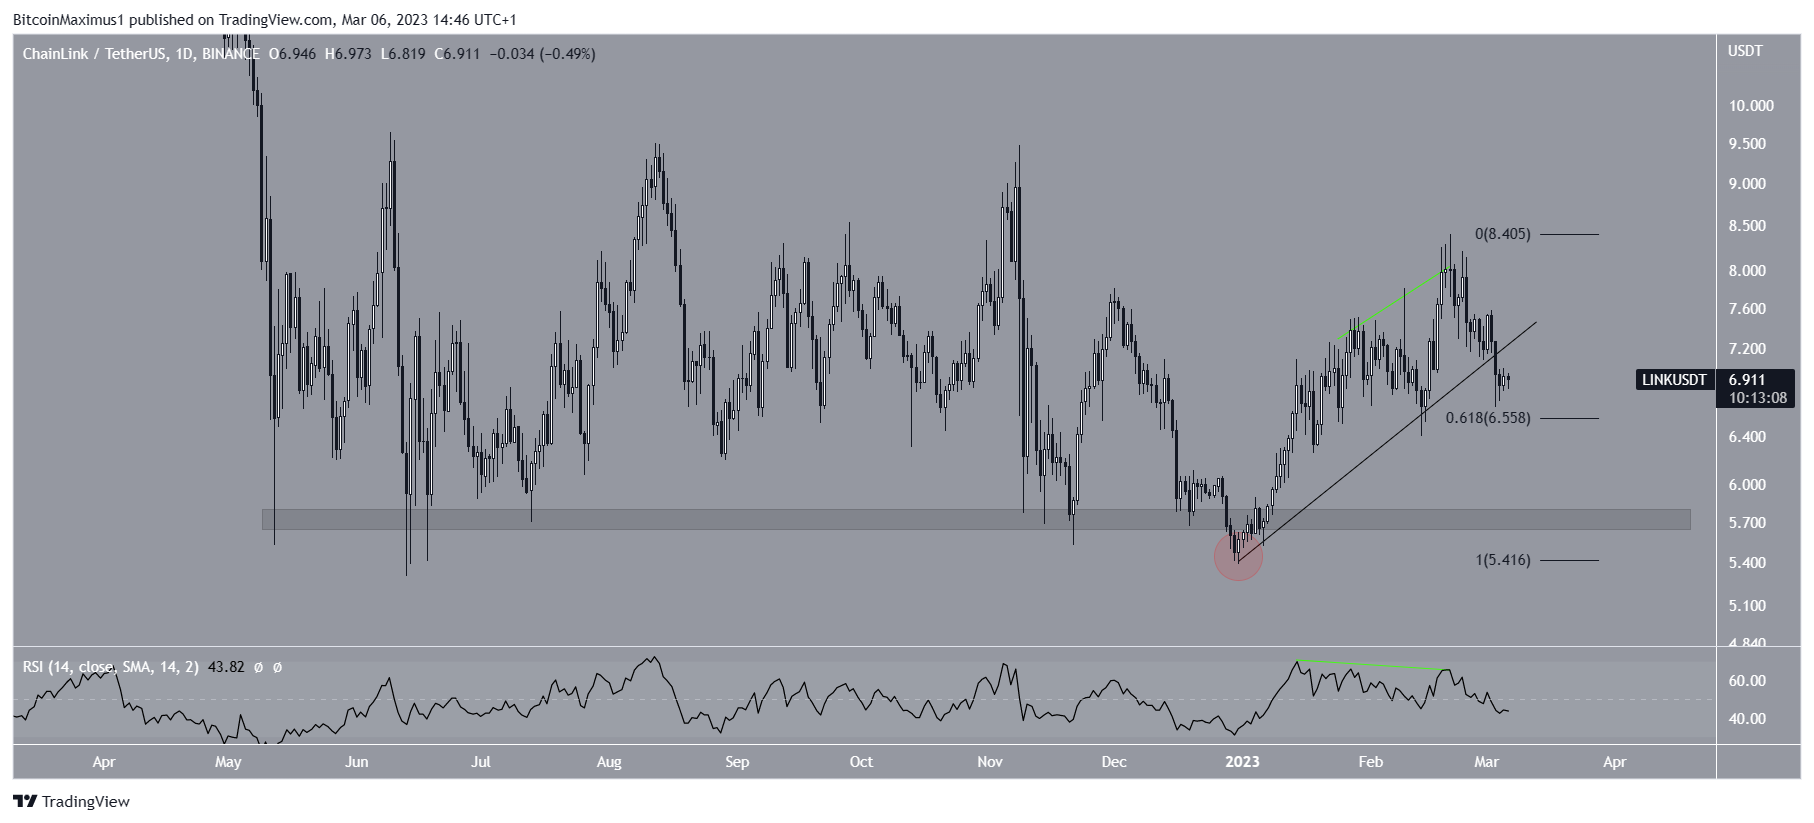
The Chainlink price had increased alongside an ascending support line since the beginning of the year, when it deviated below the $5.75 horizontal support area (red circle). The increase led to a high of $8.40 on Feb. 20. However, the price reversed its trend shortly afterward and has fallen since.
The decrease was preceded by bearish divergence in the daily RSI (green line). Afterward, the price broke down from the support line on March 3. This is a sign that the upward movement is complete.
However, LINK is trading very close to the 0.618 Fib retracement support level at $6.56. If it bounces, it could retest the ascending support line at $7.60. On the other hand, a drop to $5.75 could follow if LINK breaks down.
Will Chainlink (LINK) Initiate a Reversal?
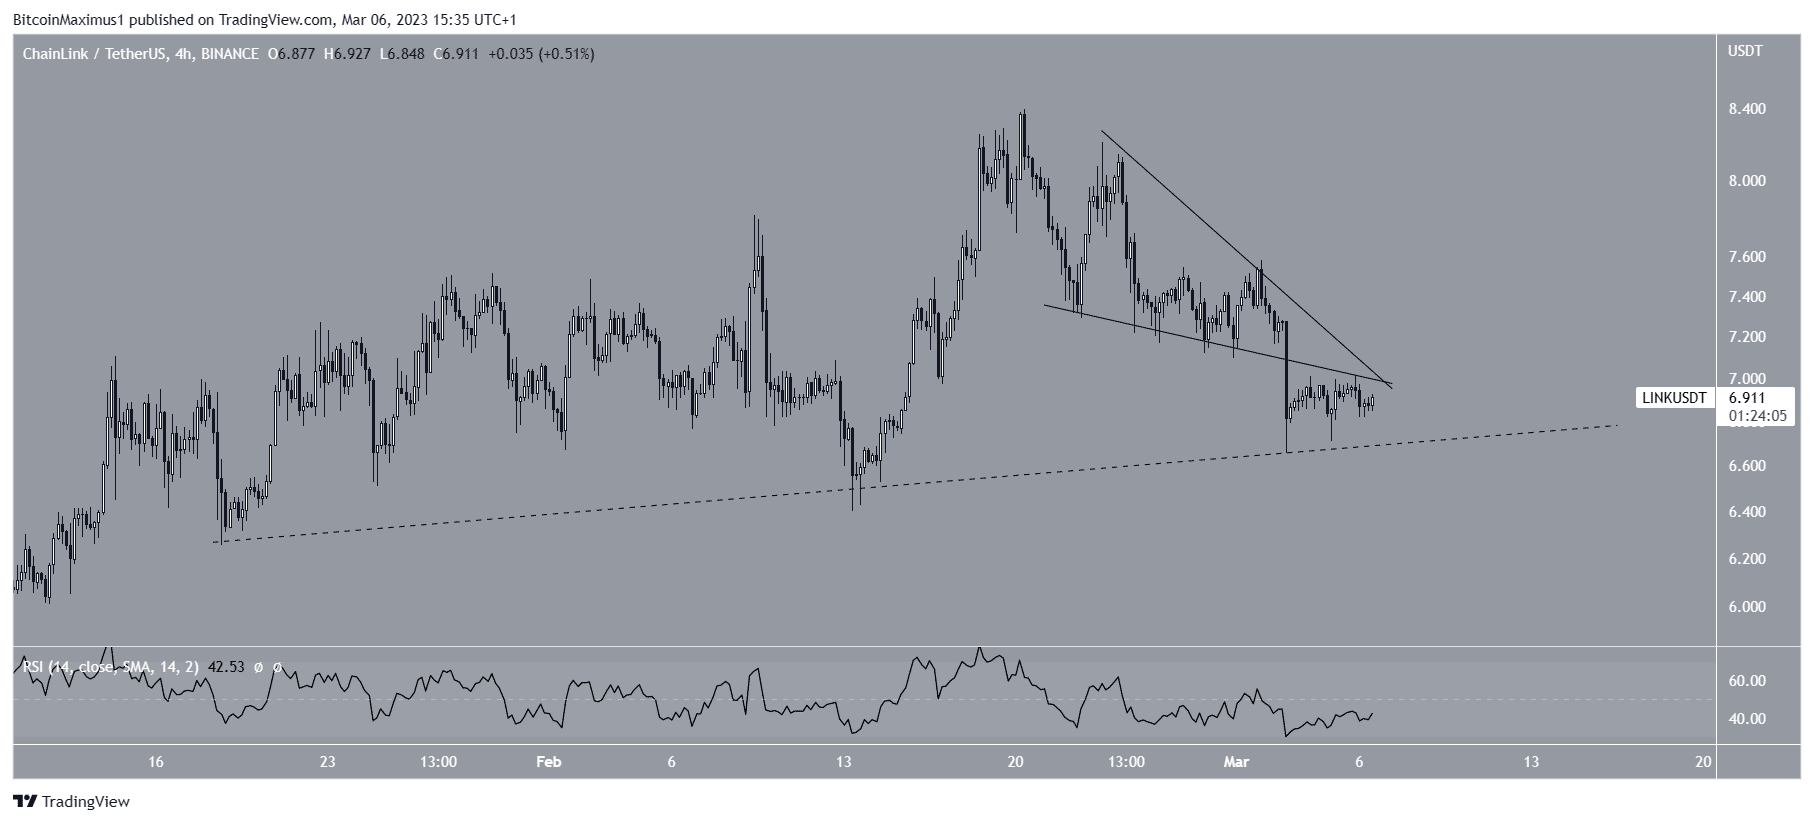
The short-term four-hour chart does nothing to help determine the trend’s direction since the price action provides mixed readings.
On the bearish side, the LINK price broke down from a descending wedge and is validating it as resistance. On the bullish side, the price bounced at an ascending support line (dashed), which coincides with the previously outlined $6.55 Fib support area.
Moreover, the daily RSI is increasing but is still below 50 and has not generated any bullish divergence.
Therefore, whether the price bounces or breaks down from the current support area could determine the future trend’s direction. A breakdown could lead to a sustained drop to $5.75, while a bounce could lead to an increase toward $7.60.
To conclude, the future LINK price forecast is unclear. Whether the price bounces at the current support level or breaks down will likely determine if the long-term trend is bullish or bearish.
For BeInCrypto’s latest crypto market analysis, click here.
The post Chainlink (LINK) Price Trades at Make-or-Break Level appeared first on BeInCrypto.


