


The Cronos (CRO) price has fallen since the end of April and lost a crucial long-term support line in May. Unless the price initiates a sharp bullish reversal immediately, more downside is likely before the price eventually regains its footing. Cronos Price Loses 178-Day Support The CRO price has followed an ascending support line since […]
The Cronos (CRO) price has fallen since the end of April and lost a crucial long-term support line in May.
Unless the price initiates a sharp bullish reversal immediately, more downside is likely before the price eventually regains its footing.
Cronos Price Loses 178-Day Support
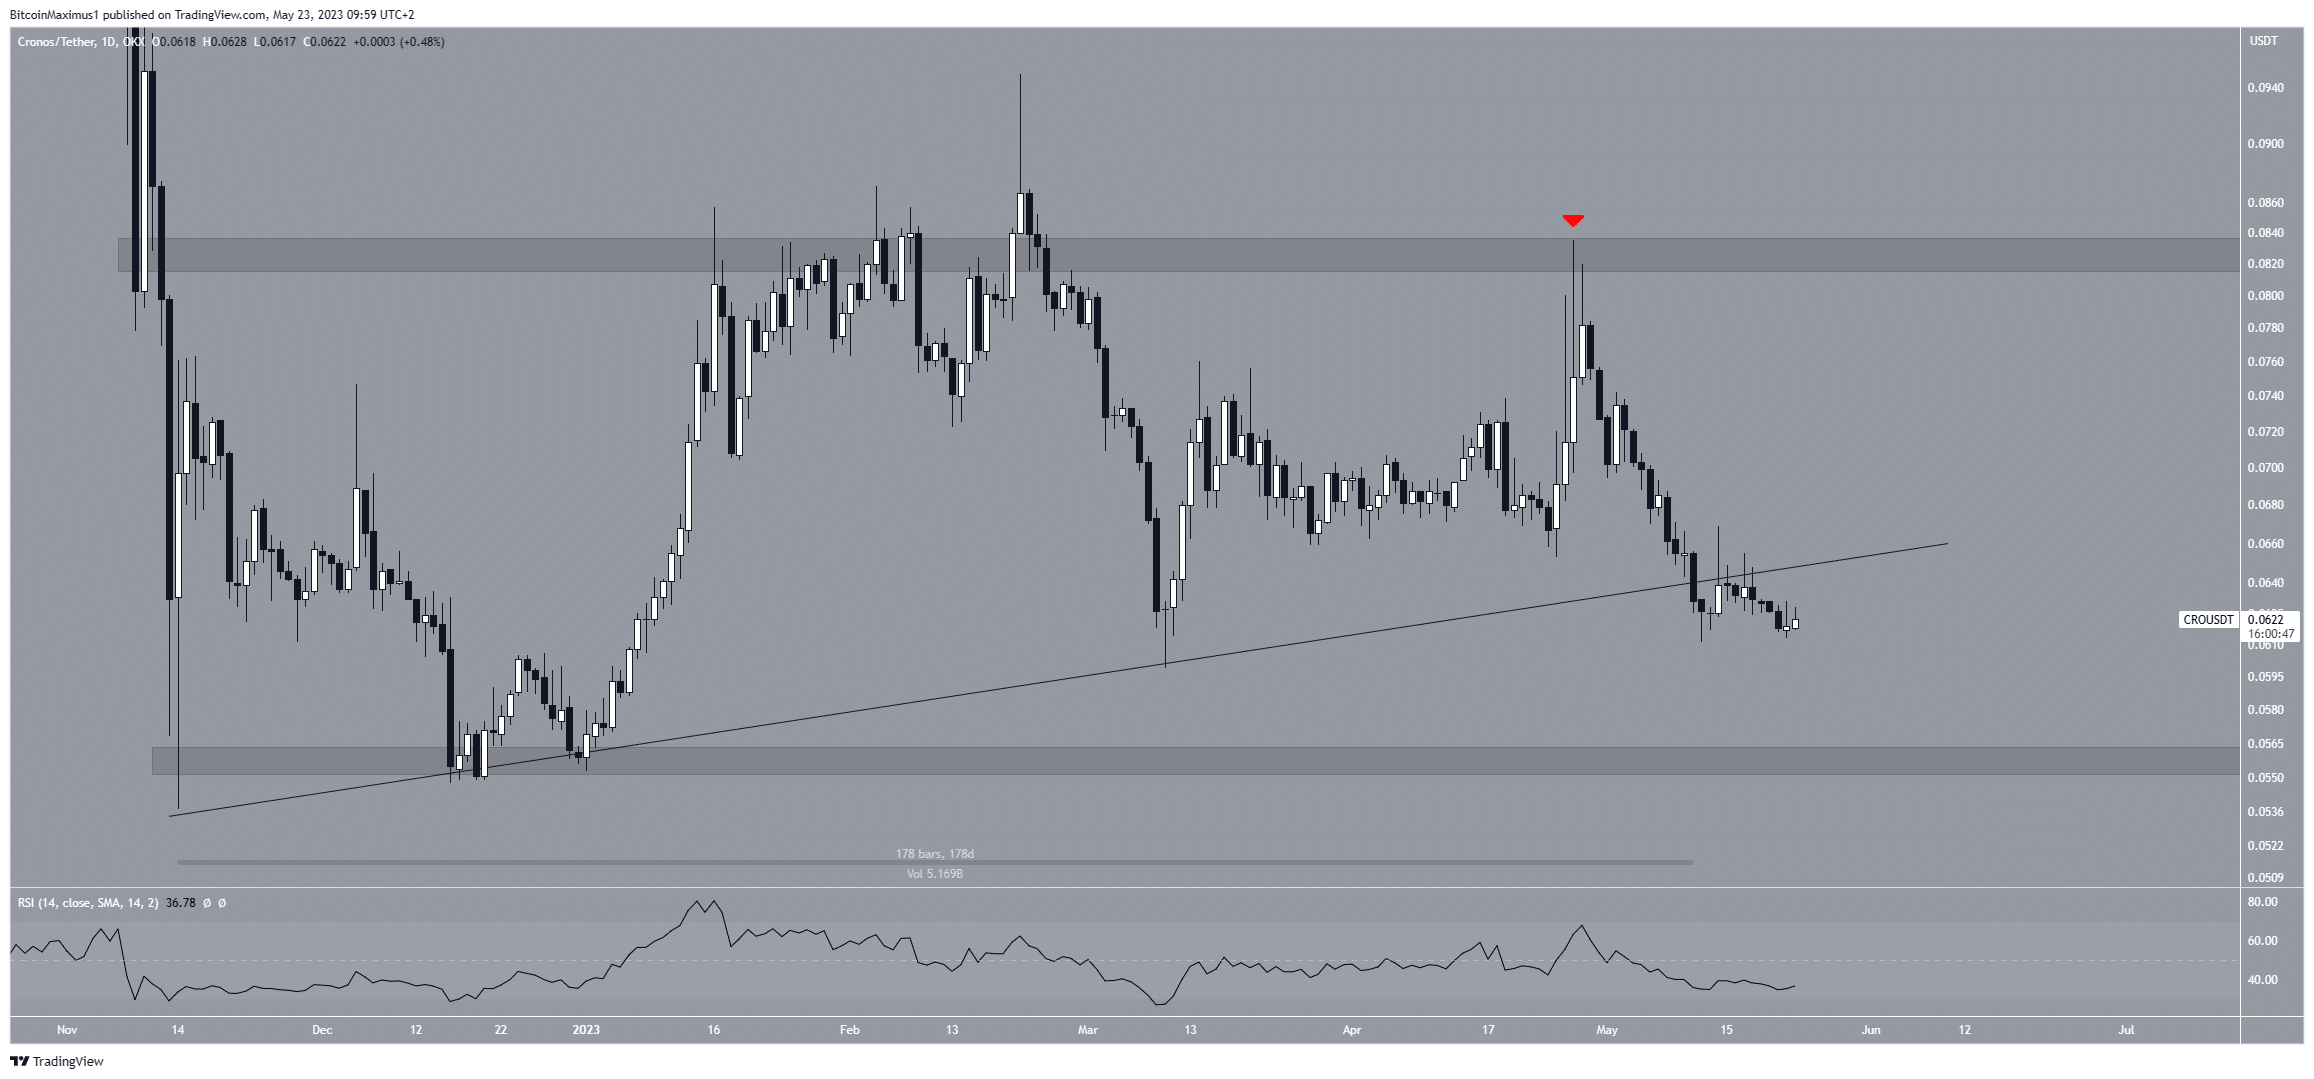
The CRO price has followed an ascending support line since November 2022. While doing so, it reached a new yearly high of $0.095 on Feb. 21.
The price fell afterward, bounced at the support line, and then validated the $0.083 horizontal resistance area (red icon). This created a long upper wick, which is considered a sign of selling pressure.
On May 11, the CRO price broke down from the ascending support line and was then validated as resistance. This is a sign of a bearish trend since it means that the previous bullish structure is now invalid.
Since the line had been in place for such a long period of time, it is possible that a new bullish reversal has now begun.
Moreover, the daily RSI is bearish. Traders utilize the RSI as a momentum indicator to assess whether a market is overbought or oversold, and to determine whether to accumulate or sell an asset.
If the RSI reading is above 50 and the trend is upward, bulls still have an advantage, but if the reading is below 50, the opposite is true. The indicator is below 50 and decreasing, a decisive sign of a bearish trend.
CRO Price Prediction: More Downside Likely?
The technical analysis from the short-term six-hour time frame aligns with the bearish readings from the daily one. The six-hour time frame suggests that the price is in the C wave of an A-B-C corrective structure (white).
Utilizing the Elliott Wave theory, technical analysts examine long-term price patterns and investor psychology that recur to determine the direction of a trend.
The defining trait of this correction is the B wave (highlighted), which is clearly a three-wave structure.
If waves A:C have a 1:1 ratio (white), the CRO price will reach a low of $0.053, close to the long-term support from the daily time frame.
Despite this bearish CRO price prediction, reclaiming the ascending support line would mean that the trend is still bullish.
In that case, the price could increase toward $0.070.
For BeInCrypto’s latest crypto market analysis, click here.
The post Cronos (CRO) Price Performance: What’s Holding It Back? appeared first on BeInCrypto.


