


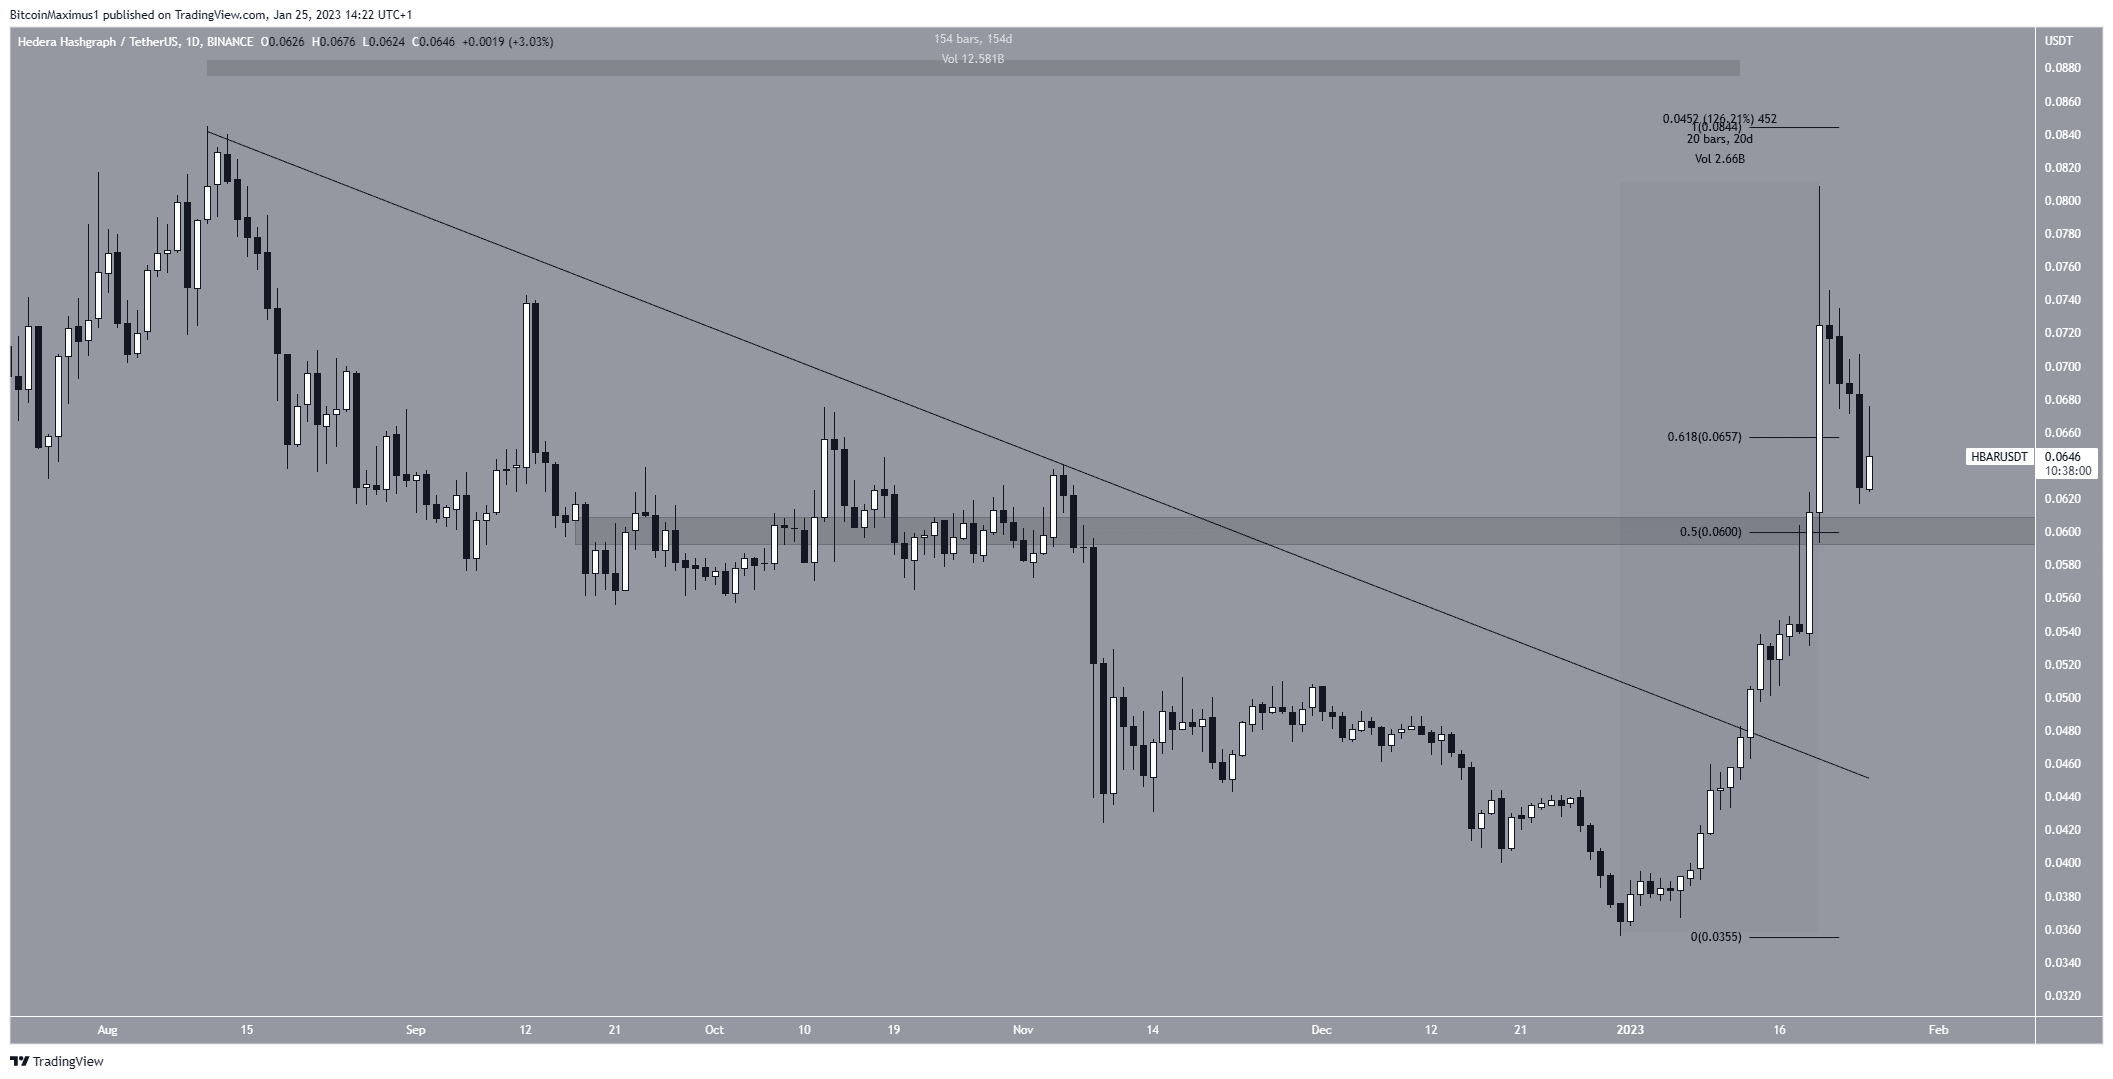
The Hedera Hashgraph (HBAR) price has completed a five-wave upward movement and is likely mired in a corrective structure. The HBAR price has increased at an accelerated rate since the beginning of the year. In a span of 20 days, it moved upward by 125%, reaching a high of $0.081 on Jan. 20. The price […]
The Hedera Hashgraph (HBAR) price has completed a five-wave upward movement and is likely mired in a corrective structure.
The HBAR price has increased at an accelerated rate since the beginning of the year. In a span of 20 days, it moved upward by 125%, reaching a high of $0.081 on Jan. 20.
The price broke out from a 154-day resistance line during the upward movement. Then it moved above both the 0.5 and 0.6 Fib retracement resistance levels at $0.060 and $0.066, respectively. This suggests that the upward movement is not corrective, but rather it is the beginning of a bullish trend reversal.
Since the 0.5 Fib retracement level at $0.060 also coincides with a horizontal support area, it is now expected to provide support.
HBAR Price Prediction for Feb: Wave Count Predicts Correction
The technical analysis from the short-term six-hour time frame shows that the HBAR price completed a five-wave upward movement. Therefore, it gives a bearish HBAR price prediction for Feb.
In it, wave five had 1.61 times the length of wave three. Therefore, it is very likely that the entire upward movement is complete.
If so, what follows is an A-B-C corrective structure, which could end near the 0.5-0.618 Fib retracement support area (white) at $0.053-$0.058.
Conversely, an increase above the $0.081 high would invalidate this bearish analysis. In that case, the HBAR price would still be in a bullish upward movement and could increase to $0.110.
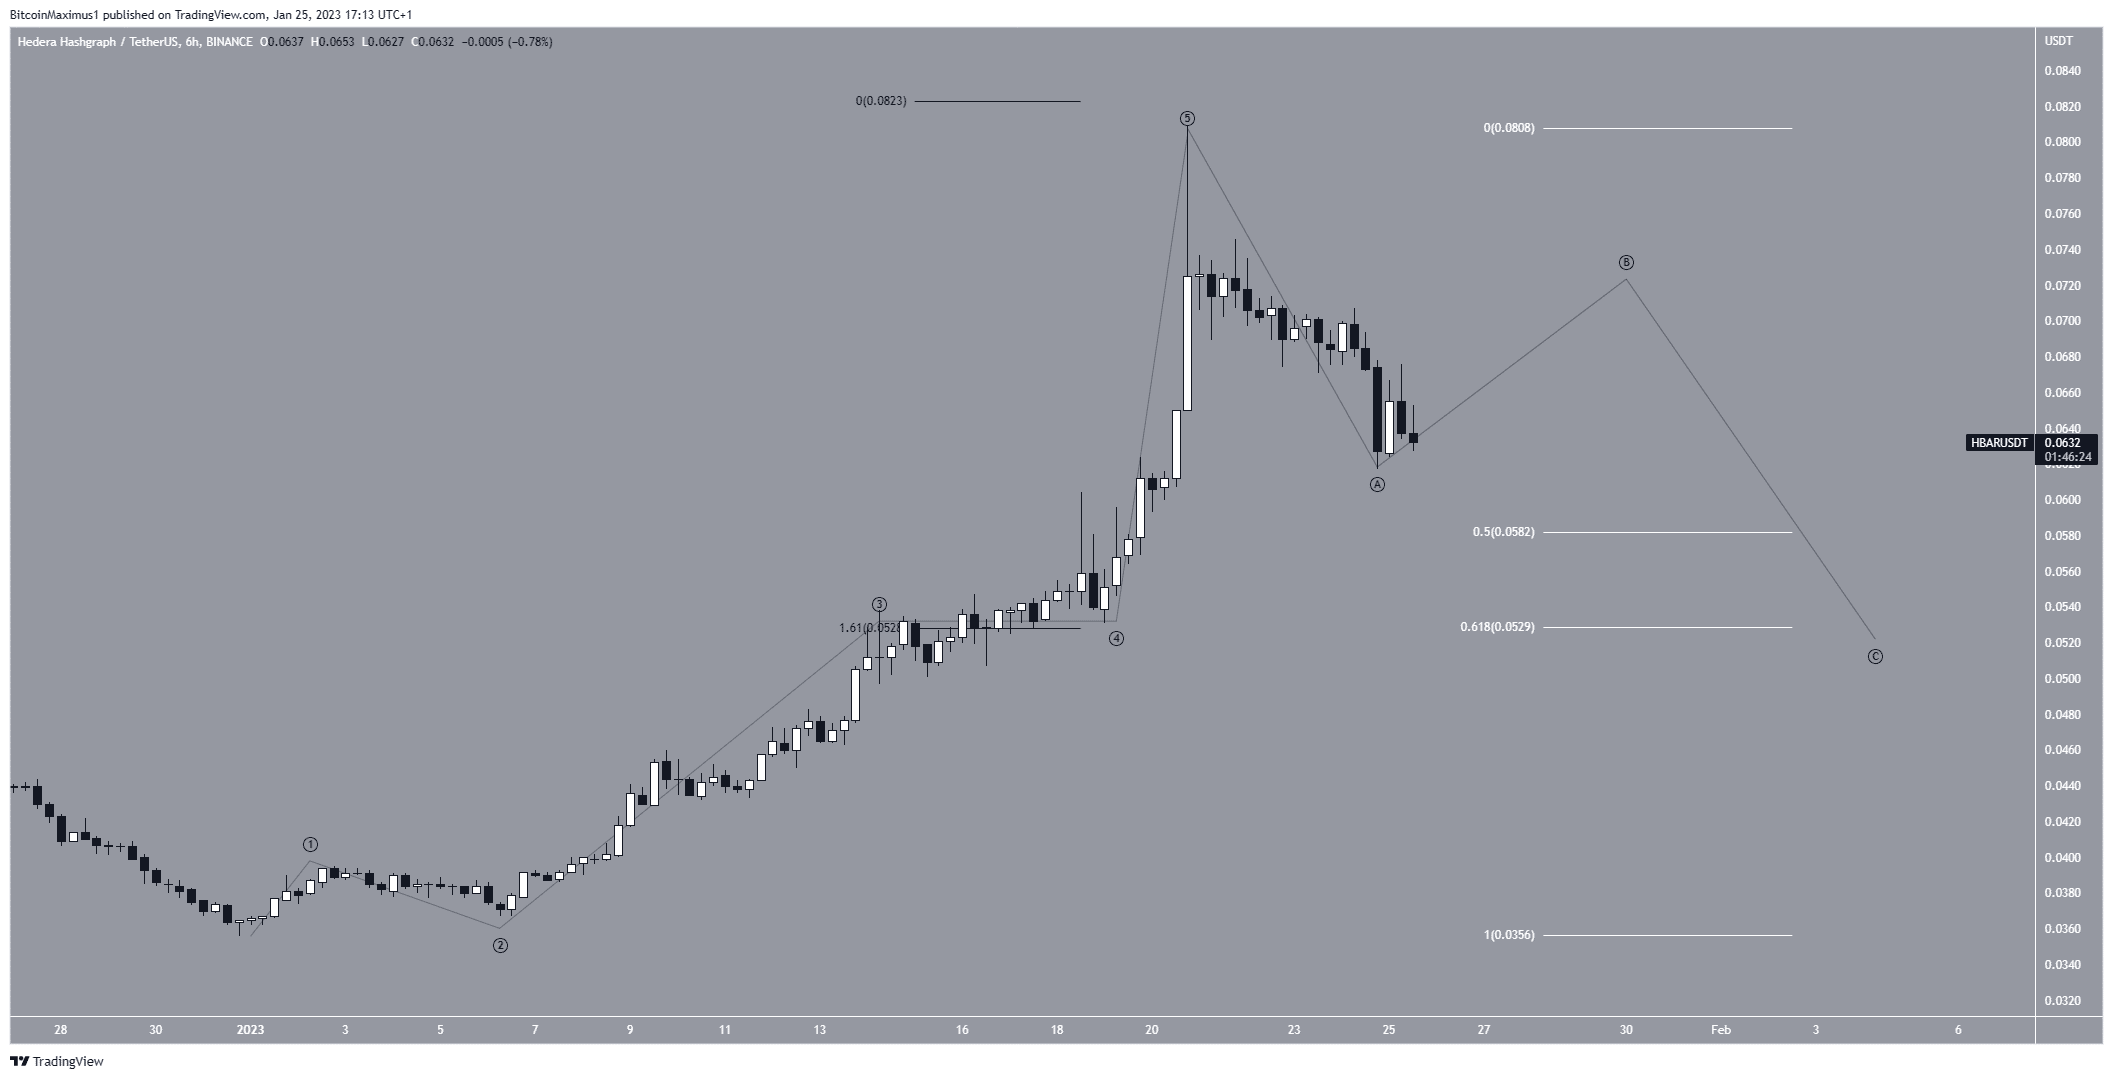
To conclude, the most likely HBAR price analysis suggests that the price will complete its correction between $0.058-$0.052. Afterward, the continuation of the upward movement is expected.
However, in case the HBAR price increases above $0.081, it would mean that the trend is still bearish. Highs near $0.110 would be expected in that case.
For BeInCrypto’s latest crypto market analysis, click here.
The post Hedera Hashgraph (HBAR) Price Destined for Brief Drop After 120% Gains appeared first on BeInCrypto.


