


The KAVA (KAVA) price has cleared an important horizontal support area, leading to a 40% increase on May 23. The price action and wave count both support the continuing increase, indicating that a new yearly high will be reached soon. KAVA Price Drops After 40% Increase The KAVA Price has increased at a rapid pace […]
The KAVA (KAVA) price has cleared an important horizontal support area, leading to a 40% increase on May 23.
The price action and wave count both support the continuing increase, indicating that a new yearly high will be reached soon.
KAVA Price Drops After 40% Increase
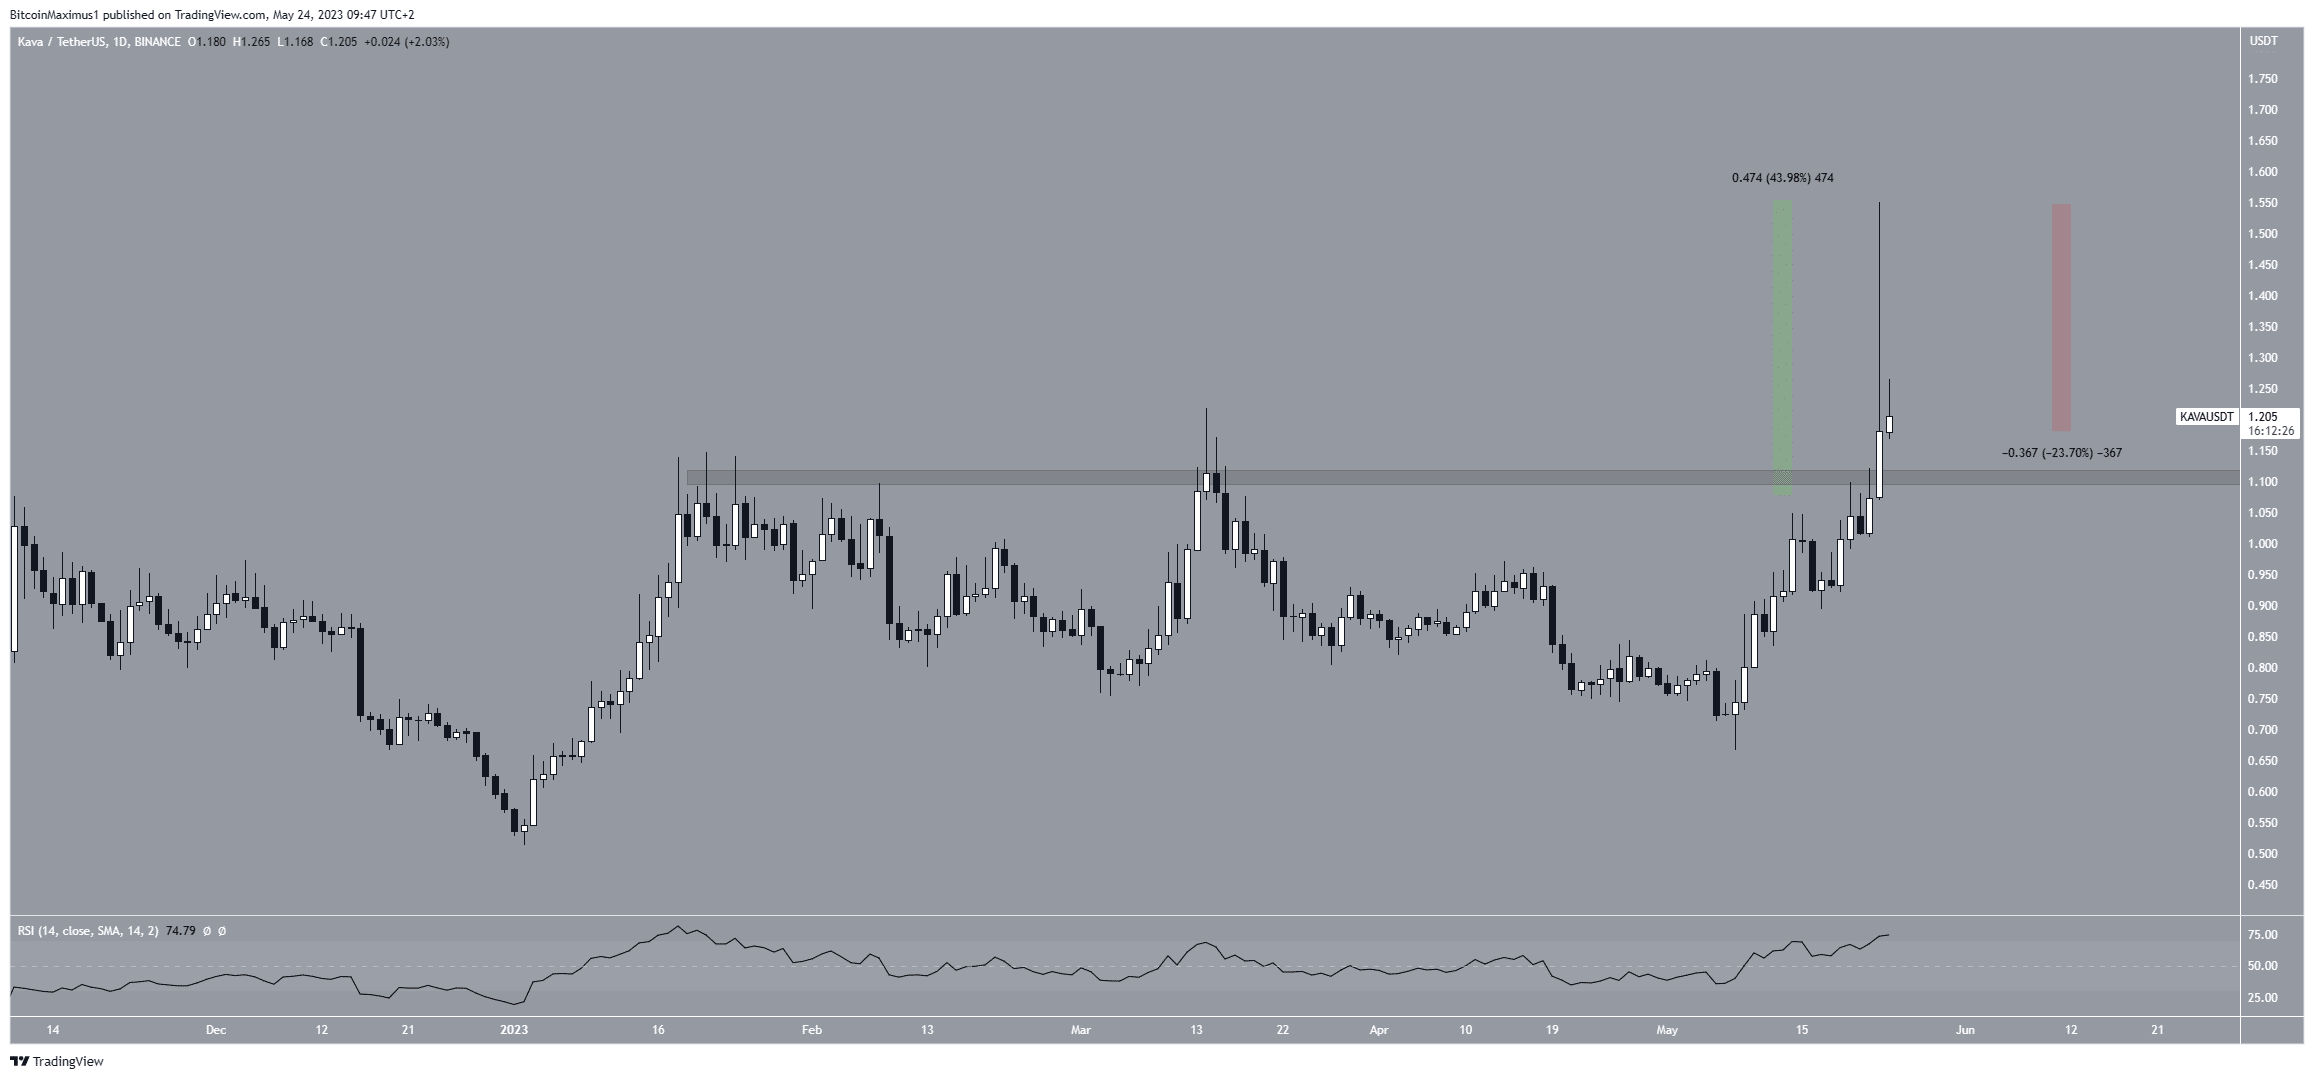
The KAVA Price has increased at a rapid pace since May 8. The increase accelerated on May 23, when the price broke out from a horizontal resistance area that had been in place since the beginning of the year.
This led to a new yearly high of $1.55 the same day, amounting to an increase of 44% in a single day (green).
However, the price failed to sustain most of its increase, dropping by 23% afterward (red) and creating a long upper wick.
This is considered a sign of selling pressure since buyers were not able to sustain the price increase.
Despite the drop, the KAVA price still trades above the breakout level at $1.10.
Moreover, the RSI provides a bullish outlook. The RSI is a momentum indicator used by traders to evaluate whether a market is overbought or oversold and to determine whether to accumulate or sell an asset.
Readings above 50 and an upward trend suggest that bulls still have an advantage, while readings below 50 indicate the opposite. The indicator is above 50 and increasing, a sign of a bullish trend.
KAVA Price Prediction: How Long Will Increase Continue?
The technical analysis from the short-term six-hour chart gives a bullish KAVA price prediction. There are two reasons for this.
Firstly, the price broke out from a descending resistance line. This aligns with the breakout from the horizontal resistance area and increases its validity.
Secondly, the wave count supports the increase. To determine the direction of a trend, technical analysts use the Elliott Wave theory, which involves studying recurring long-term price patterns and investor psychology.
The wave count indicates that the KAVA price is in the third wave of a five-wave upward movement (white). If so, a potential target for the top will be between $2.06-$2.29, found by the 3.61-4.21 Fib extension of wave one.
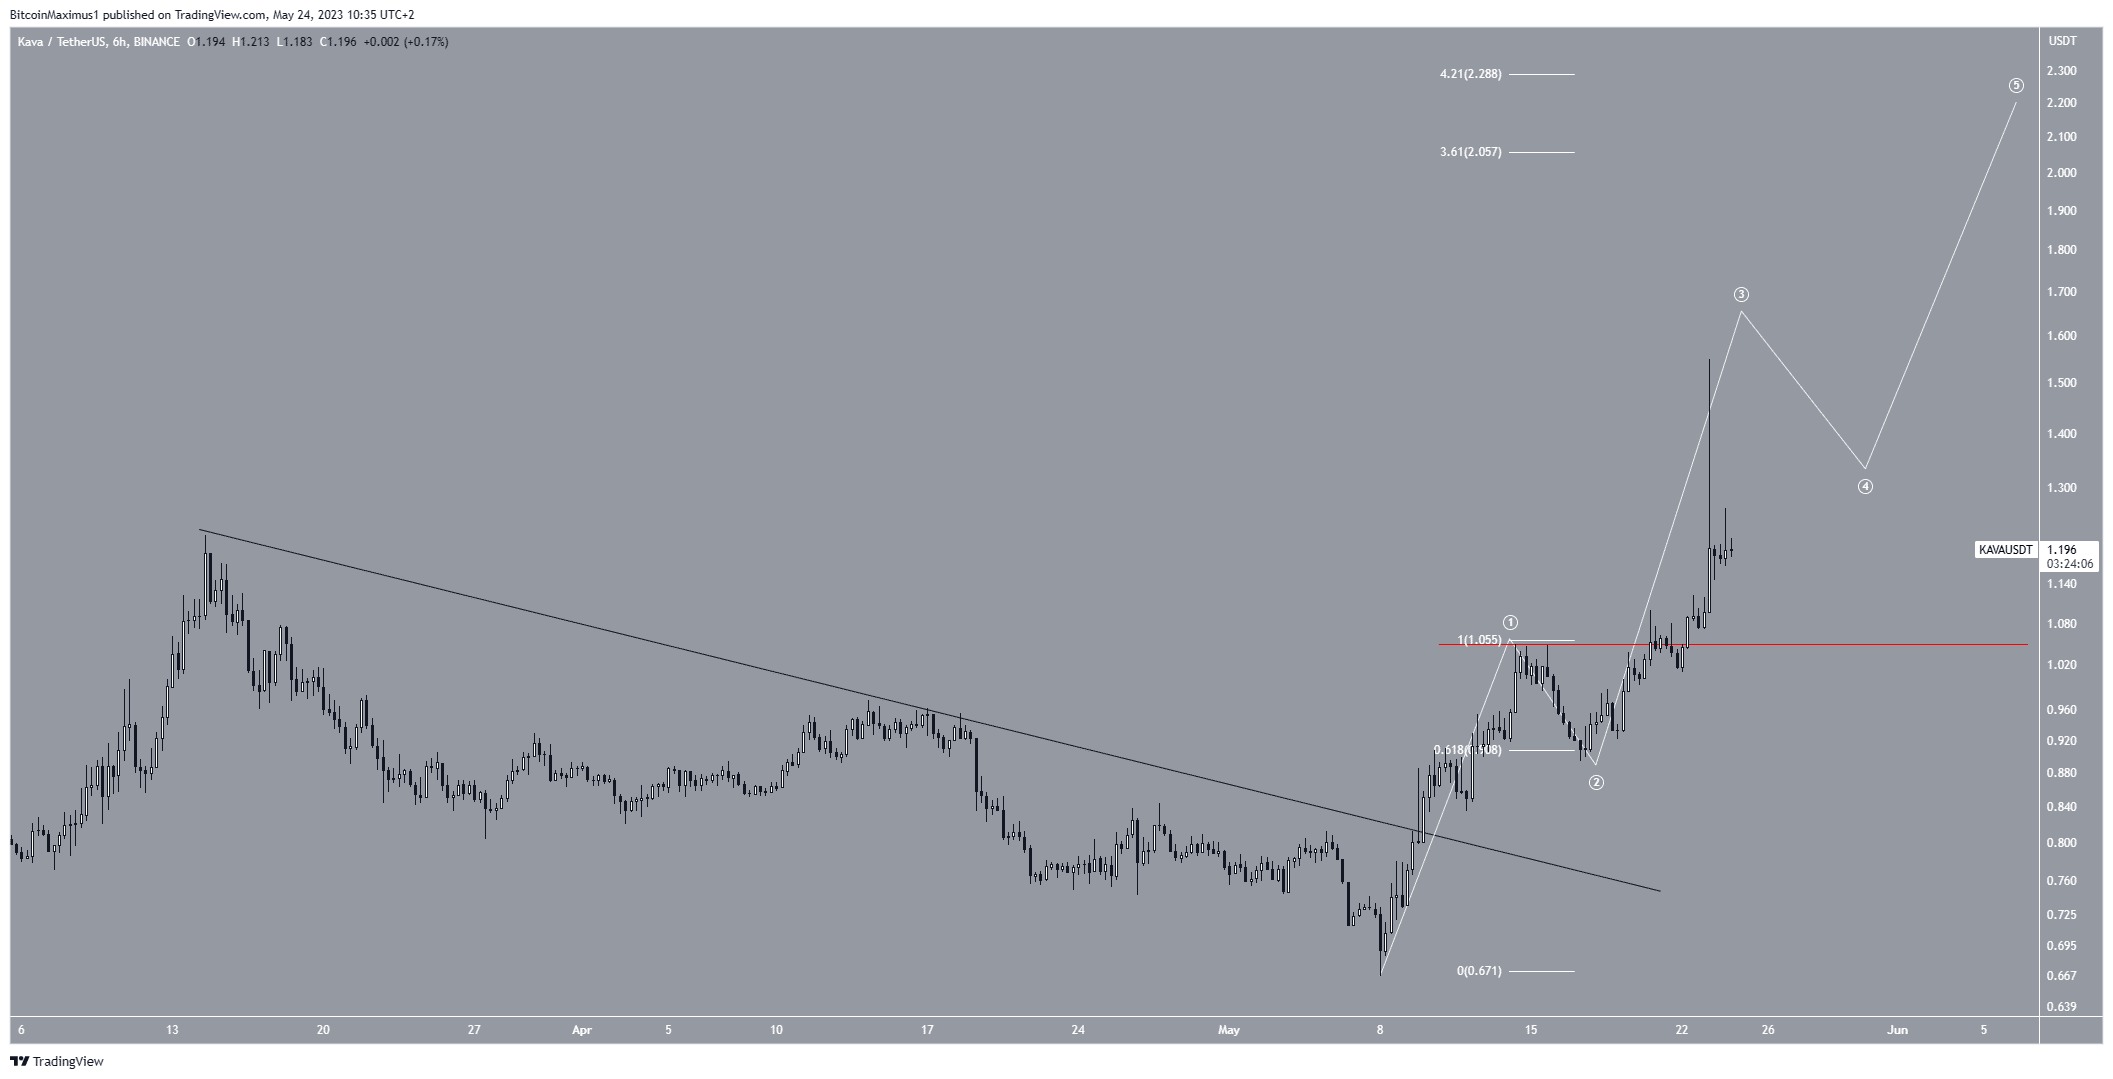
Despite this bullish KAVA price prediction, a drop below the wave one high (red line) at $1.03 will mean that the trend is bearish.
For BeInCrypto’s latest crypto market analysis, click here.
The post Kava (KAVA) Witnesses Impressive 40% Price Jump: What’s Driving It? appeared first on BeInCrypto.


