


Yesterday’s daily close of Nasdaq (NDX), the largest index of technology companies (NDX), was very bullish. The index not only broke out above long-term resistance levels but also hit its highest value in more than a year. The Nasdaq remains in a long-term positive correlation with the Bitcoin (BTC) price. However, this correlation has been […]
Yesterday’s daily close of Nasdaq (NDX), the largest index of technology companies (NDX), was very bullish. The index not only broke out above long-term resistance levels but also hit its highest value in more than a year.
The Nasdaq remains in a long-term positive correlation with the Bitcoin (BTC) price. However, this correlation has been weakening for several days and is currently negative on the daily time frame.
Despite these diverging directions, could this be a bullish signal for the cryptocurrency market?
What Is Nasdaq?
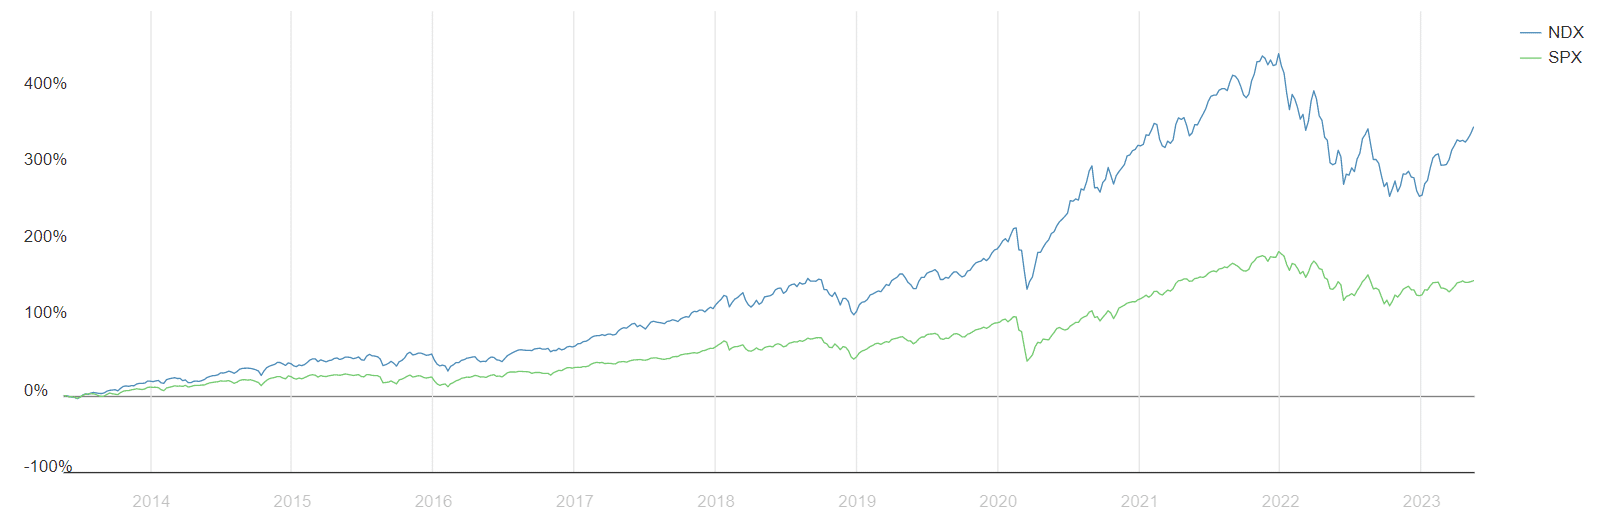
The Nasdaq-100 Index (NDX) is a metric of the health of modern industry and innovation. Along with the Dow Jones Industrial Average and the S&P 500, it is one of the three most widely tracked stock market indexes in the United States.
The Nasdaq-100 index consists of the 100 largest technology companies listed on the NASDAQ (National Association of Securities Dealers Automated Quotations).
The entire exchange tracks the performance of more than 2,500 assets, but about 90% of its movement is expressed by the NDX.
The Nasdaq-100 is a modified capitalization-weighted index. The weights of stocks in the index are based on their market capitalization, with some rules limiting the influence of the largest components.
Unlike the S&P 500 Index (SPX), which tracks the performance of the 500 largest companies in the US, the NDX is limited to the high-tech and innovation sector.
Nasdaq Breaks One-Year High
Like Bitcoin and the broad cryptocurrency market, the Nasdaq has been in an uptrend since early 2023. After hitting a bottom at 10,440, the NDX generated a triple bottom pattern in October-December 2022 (blue arrows).
Subsequently, the uptrend, which continues to this day, began. The first signal of a bullish trend reversal was the breakout above the descending resistance line (black), which was in place from the all-time high (ATH) at 16,765 on November 22, 2021.
Subsequently, the NDX paused in the 12,750 area (green), which corresponds to the 0.382 Fib retracement level, measuring for the entire 38% drop from the ATH.
This is a frequent area for the end of corrective movements. Its breakthrough, which occurred in March 2023, indicates that the Nasdaq has started a new uptrend, rather than just correcting a long-term downtrend.
What’s more, this level was confirmed as support in late April (green arrow). This event initiated another wave of upward movement, which led to yesterday’s breakout above another important resistance level at 0.5 Fib (red).
Since the beginning of January 2023, the NDX has surged more than 29%.
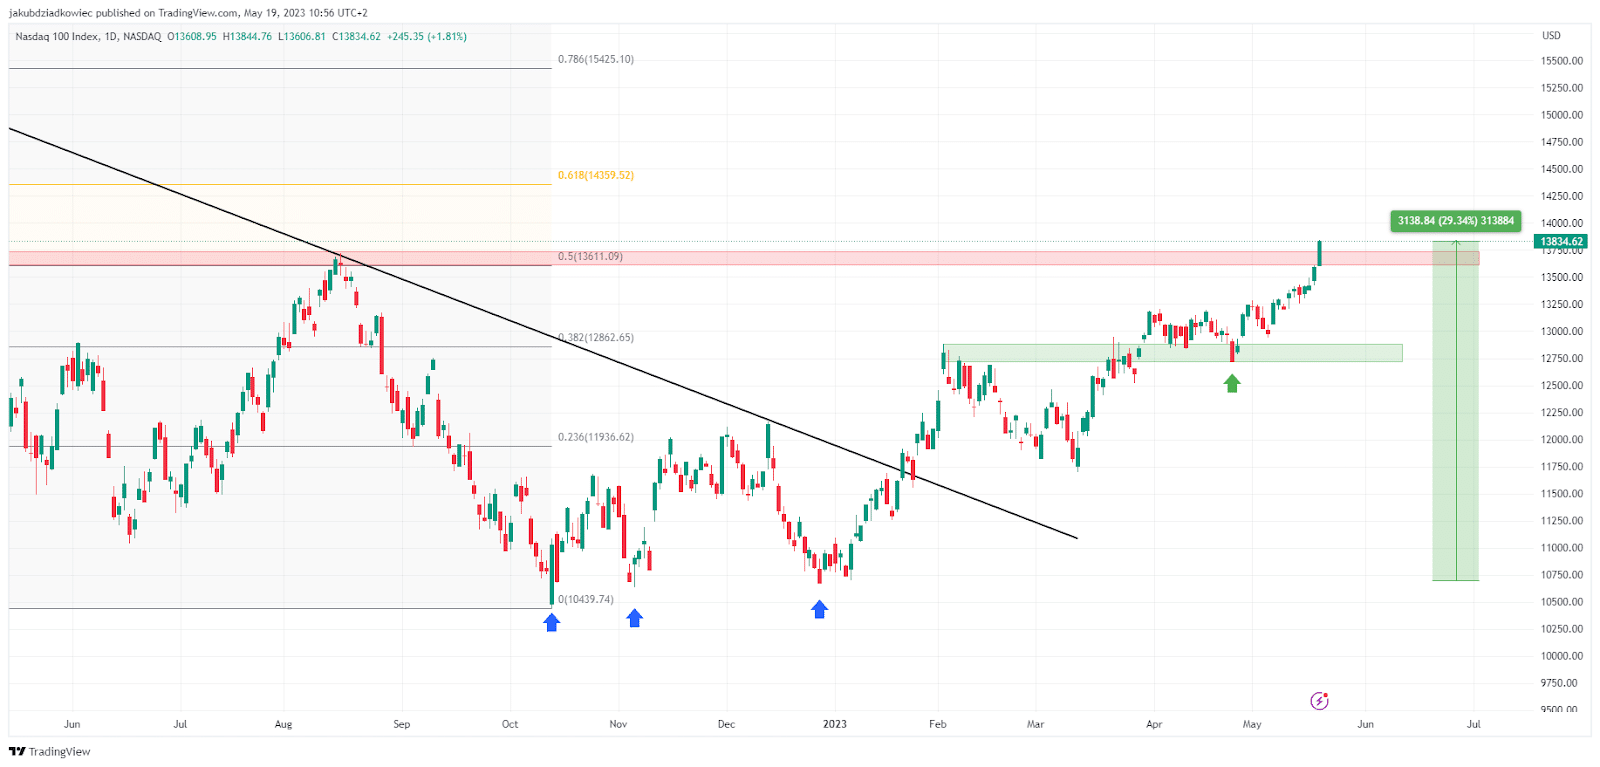
If the uptrend continues, the next resistances are at 14,360 and 15,425, corresponding to the 0.618 and 0.786 Fib levels. On the other hand, rejection from current levels could result in a bullish re-test of the previous breakout area near 13,200.
NDX Rises 17% on Average After New One-Year High
Technical indicators support the continuation of the uptrend. Admittedly, the RSI is already in the overbought area, but it has not yet generated any bearish divergence. MACD, on the other hand, is rising and generating another bar of bullish momentum.
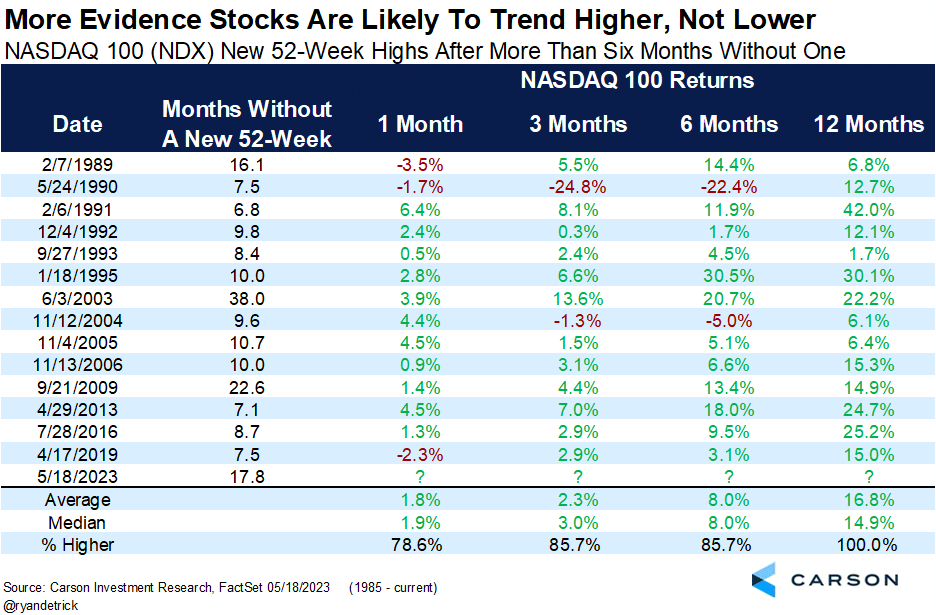
One more argument for the continuation of the Nasdaq index’s upside was provided today on Twitter by market analyst @RyanDetrick. He published a chart that shows the historical movements of the index after it recorded its first new peak after 52 weeks.
Such a situation has occurred 14 times so far in history. On average, it led to almost 17% increases in the following 12 months. Currently, it appears for the 15th time. If “this time is no different,” the upward trend is expected to continue.
Negative Correlation With Bitcoin Price
The long-term correlation of the Nasdaq index with the Bitcoin price remains positive. Major technology companies and the cryptocurrency market follow similar trends.
However, from time to time the NDX periodically loses its positive correlation with BTC on the daily chart (blue areas). This most often happens during a change in the direction of the long-term trend or during deeper market corrections.
Over the past 12 months, the daily correlation between the two charts became negative only 3 times. The first time was in November-December 2022 when Bitcoin generated a macro bottom at $15,495.
At that time, NDX was already after its bottom, rebounding and starting the accumulation process. Bitcoin did not begin its rebound until a month later.
The second time a slight negative correlation appeared was in February-March 2023. At that time, the BTC price experienced a correction to $19,500.
Then the Nasdaq maintained a sideways trend for about a month. After the positive correlation between the charts was restored, both indexes continued their uptrend.
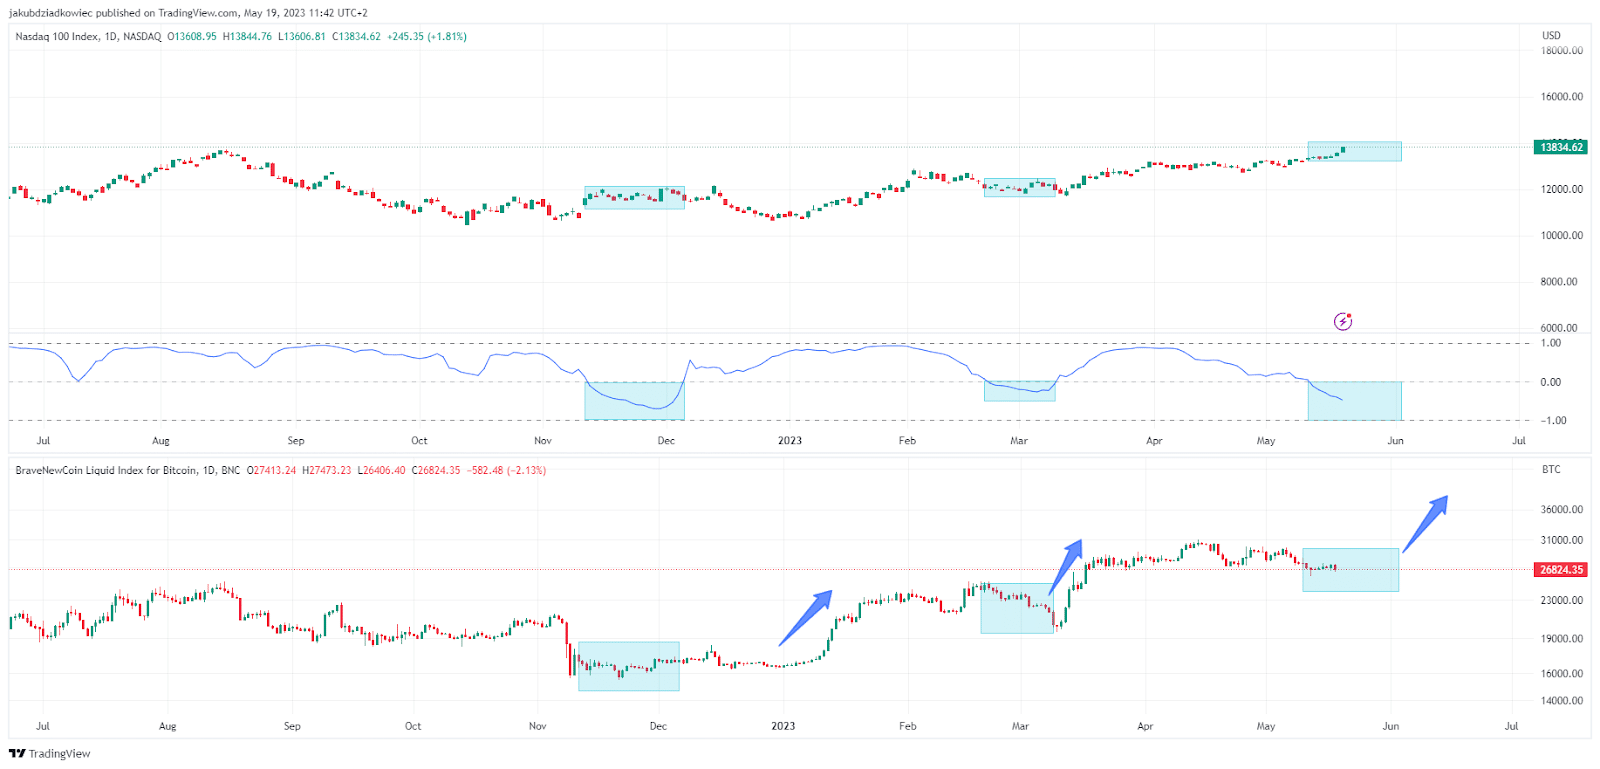
Currently, the third period of negative correlation in the last 12 months has begun. Bitcoin is consolidating in the $26,000-$28,000 range, while the Nasdaq is surging.
If the scenario of the previous two periods is repeated, the price of BTC could rise dynamically once a positive correlation is restored.
Moreover, a very bullish signal in the cryptocurrency market will be the potential continuation of the uptrend for NDX.
If the data from the chart of historical Nasdaq movements presented above is reliable, the next few months will lead to a return of the Bitcoin price above $30,000.
For BeInCrypto’s latest crypto market analysis, click here.
The post NASDAQ (NDX) Hits Yearly High: Is Negative Correlation With BTC a Bullish Signal? appeared first on BeInCrypto.


