


The NEO (NEO) price has broken out from a long-term resistance level but has failed to sustain its rally. Even though the price fell below a crucial resistance after the breakout, the price action and wave count suggest another rally is forthcoming. Can NEO Sustain Breakout? The weekly NEO outlook is mixed since bullish and […]
The NEO (NEO) price has broken out from a long-term resistance level but has failed to sustain its rally.
Even though the price fell below a crucial resistance after the breakout, the price action and wave count suggest another rally is forthcoming.
Can NEO Sustain Breakout?
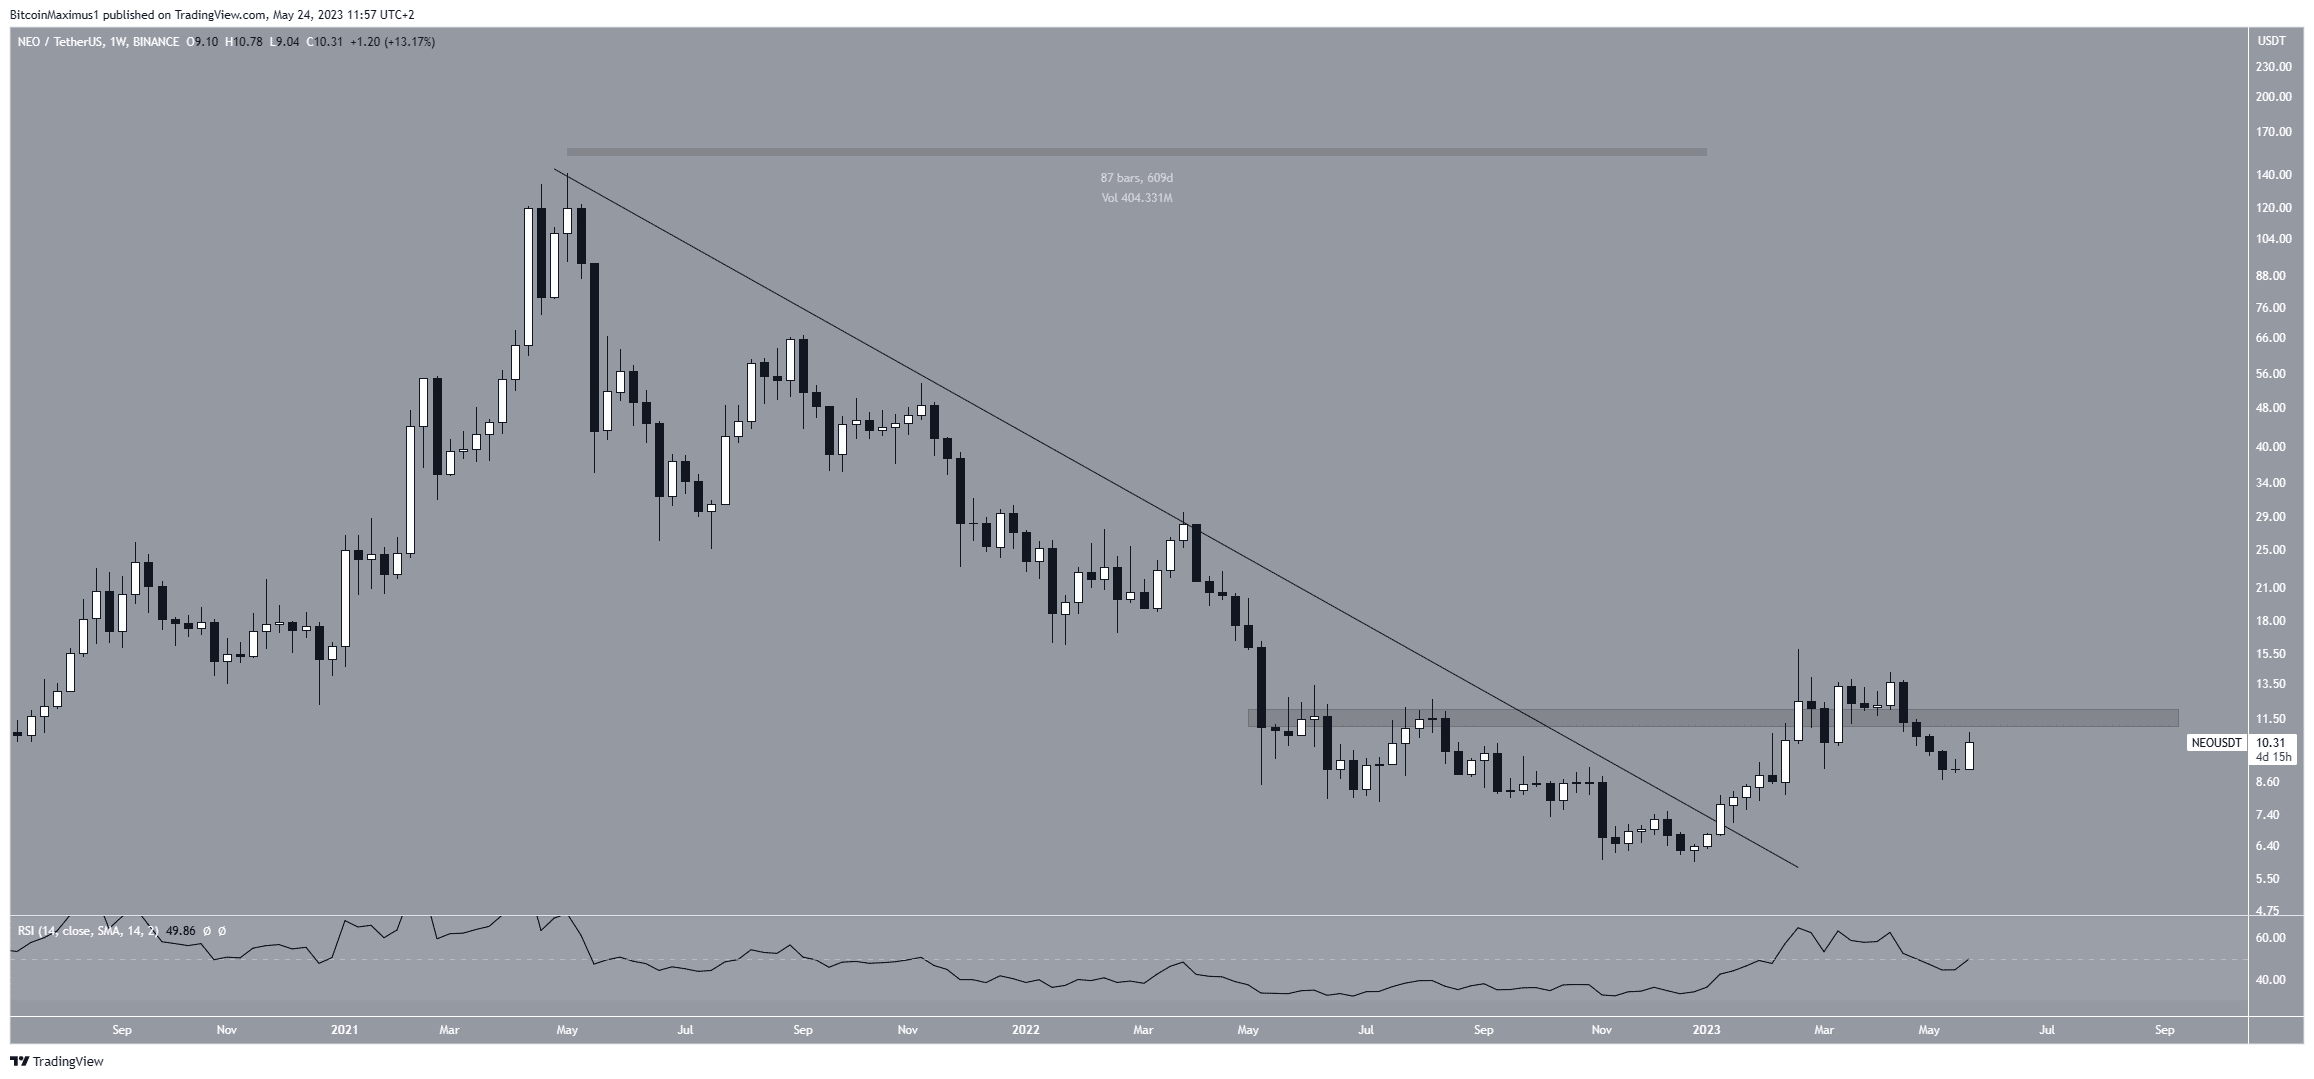
The weekly NEO outlook is mixed since bullish and bearish signs are in place. On the bullish side, the price broke out from a 609-day resistance line. This led to a sharp upward movement and a new yearly high of $15.80 in February.
While this seemingly caused a reclaim of the $12 horizontal area, the price fell below it shortly afterward. The area is now expected to provide resistance.
Such deviations are considered bearish signs since buyers could not sustain the rally.
Finally, the RSI provides a mixed outlook. Traders utilize the RSI as a momentum indicator to assess whether a market is overbought or oversold, and to determine whether to accumulate or sell an asset.
If the RSI reading is above 50 and the trend is upward, bulls still have an advantage, but if the reading is below 50, the opposite is true. The indicator is increasing but has fallen below 50. So, the trend is undetermined until the RSI either get rejected or reclaims the 50 line.
NEO Price Prediction: Wave Count Suggests Correction Is Complete
The technical analysis from the daily time frame indicates that the correction ongoing since the end of February is complete. There are multiple reasons for this.
Firstly, the price bounced at the $9.20 horizontal support area after previously deviating below it. This created a long lower wick (green icon), considered a sign of buying pressure. Both the deviation and long lower wick are considered bullish signs.
Secondly, the daily RSI has generated a bullish divergence. A bullish divergence (green line) occurs when a momentum decrease does not accompany a price decrease. This often leads to bullish trend reversals.
Finally, the wave count provides a bullish reading. By studying recurring long-term price patterns and investor psychology, technical analysts utilize the Elliott Wave theory to ascertain the trend’s direction.
The wave count shows a completed A-B-C corrective structure (white), in which waves A:C has a 1:1 ratio.
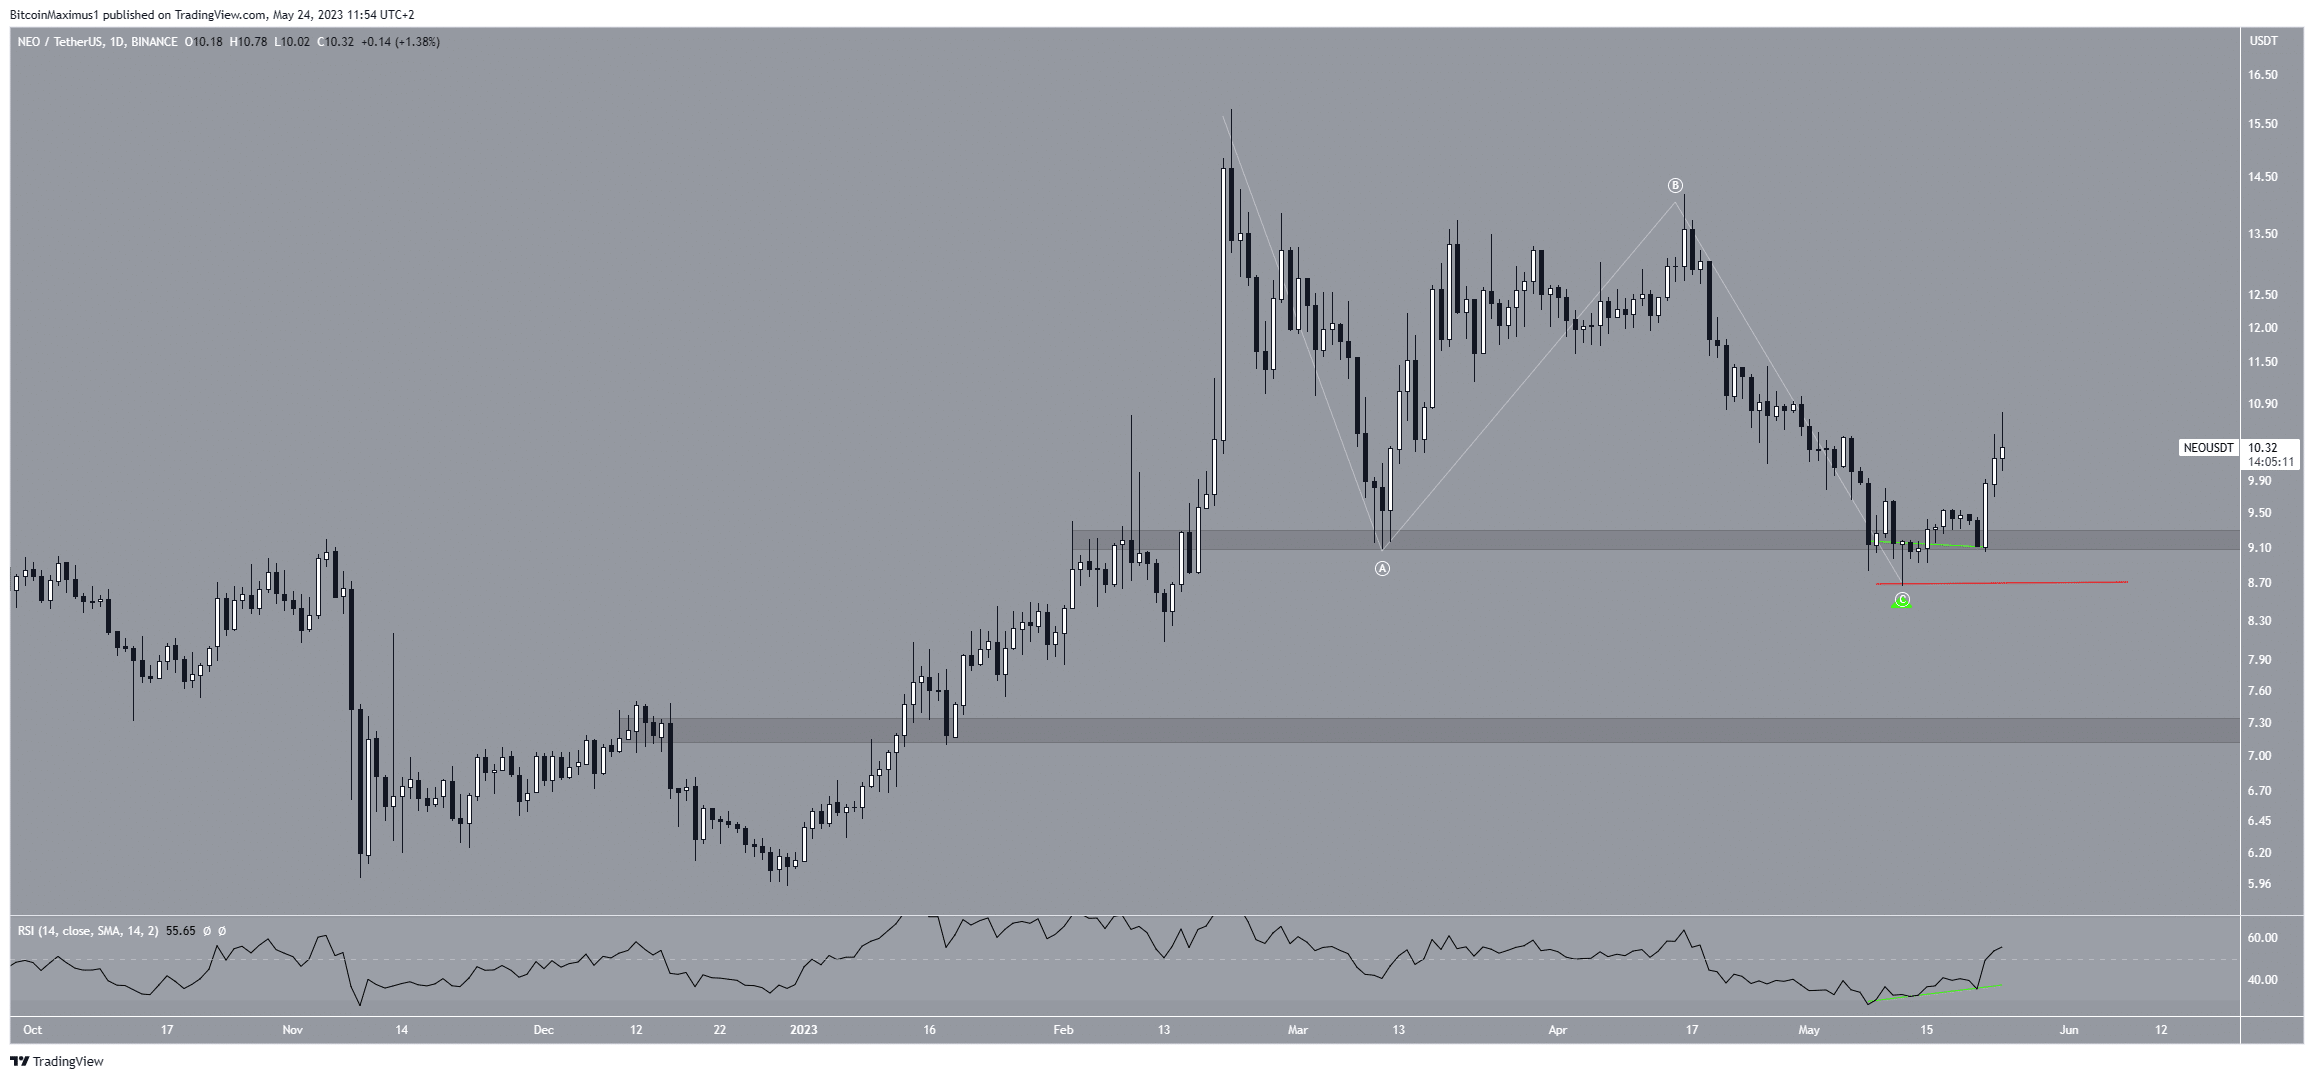
Despite this bullish NEO price prediction, a decrease below the wave C low of $7.61 (red line) will mean that the trend is bearish. In that case, a drop to the next closest support at $7.20 will be the most likely scenario.
For BeInCrypto’s latest crypto market analysis, click here.
The post NEO (NEO) Price Pulls Back, but Bullish Momentum Remains appeared first on BeInCrypto.


