


Previous on-chain research suggested the Bitcoin market bottom was in. CryptoSlate revisited several Glassnode metrics, which continue to indicate a bottoming of price. However, macro factors, which may not have been present in previous cycles, remain in play, potentially impacting the current cycle. Bitcoin Supply P/L Bands Bitcoin Supply P/L Bands show the circulating supply […]
Previous on-chain research suggested the Bitcoin market bottom was in. CryptoSlate revisited several Glassnode metrics, which continue to indicate a bottoming of price.
However, macro factors, which may not have been present in previous cycles, remain in play, potentially impacting the current cycle.
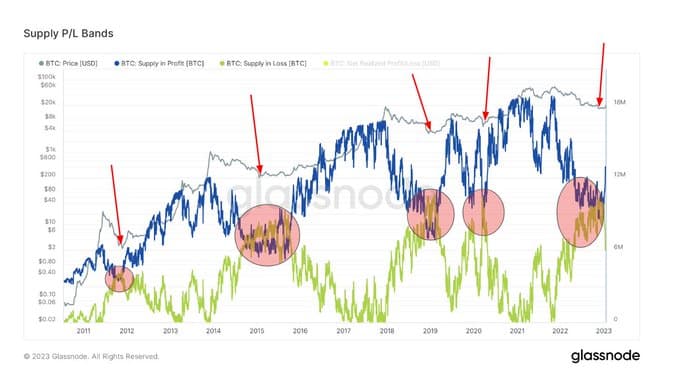
Bitcoin Supply P/L Bands
Bitcoin Supply P/L Bands show the circulating supply that is either in profit or loss, based on the price of the token being higher or lower than the current price at the time of last moving.
Market cycle bottoms coincide with the Supply in Profit (SP) and Supply in Loss (SL) lines converging, which happened most recently around Q4 2022. The subsequent act of the lines diverging has corresponded with price reversals in the past.
Currently, the SP band has moved up sharply to diverge from the SL band, suggesting a macro upturn in price could be on the cards if the pattern holds.
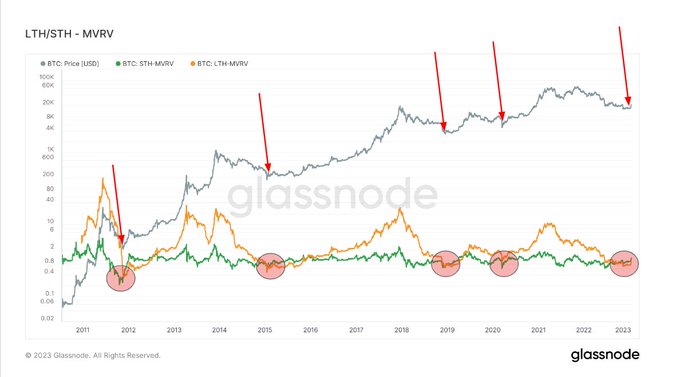
Market Value to Realized Value
Market Value to Realized Value (MVRV) refers to the ratio between the market cap (or market value) and realized cap (or the value stored). By collating this information, MVRV indicates when the Bitcoin price is trading above or below “fair value.”
MVRV is further split by long-term and short-term holders, with Long-Term Holder MVRV (LTH-MVRV) referring to unspent transaction outputs with a lifespan of at least 155 days and Short-Term Holder MVRV (STH-MVRV) equating to unspent transaction lifespans of 154 days and below.
Previous cycle bottoms featured a convergence of the STH-MVRV and LTH-MVRV lines, with the former crossing above the latter to signal a bullish reversal in price.
During Q4 2022, a convergence between the STH-MVRV and LTH-MVRV lines occurred. And, within recent weeks, the STH-MVRV has crossed above the LTH-MVRV, signaling the possibility of a price trend reversal.
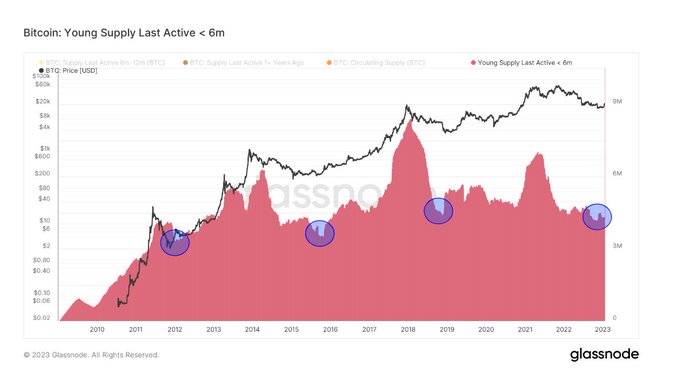
Young Supply Last Active < 6m & Holders in Profit
Young Supply Last Active <6m (YSLA<6) refers to Bitcoin tokens that have transacted within the last six months. The opposing scenario would be long-term holders sitting on their tokens and not actively participating in the Bitcoin ecosystem.
At bear market bottoms, YSLA<6 tokens account for less than 15% of the circulating supply as non-believers/hit-and-run speculators leave the market during the cycle of depressed prices.
The chart below shows YSLA<6 tokens reached the “less than 15% threshold” late last year, suggesting a capitulation of speculative interest.
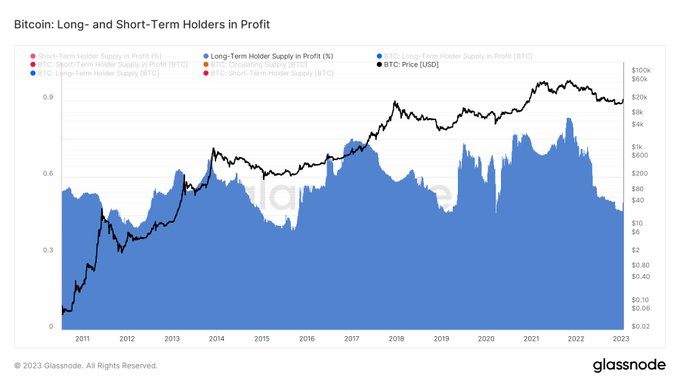
Similarly, the chart below shows Long-Term Holders in Profit currently close to All-Time Lows (ATLs.) This corroborates that long-term holders hold most of the supply and remain unfazed by the -75% price drawdown from the market top.
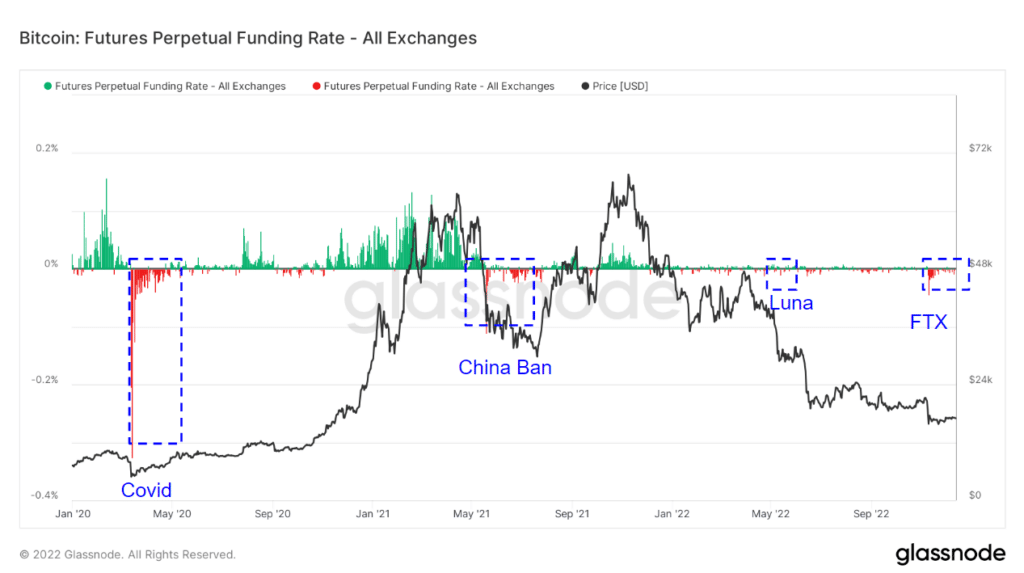
Futures Perpetual Funding Rate
The Futures Perpetual Funding Rate (FPFR) refers to periodic payments made to or by derivatives traders, both long and short, based on the difference between perpetual contract markets and the spot price.
During periods when the funding rate is positive, the price of the perpetual contract is higher than the marked price. In this instance, long traders pay for short positions. In contrast, a negative funding rate shows perpetual contracts are priced below the marked price, and short traders pay for longs.
This mechanism keeps futures contract prices in line with the spot price. The FPFR can be used to gauge traders’ sentiment in that a willingness to pay a positive rate suggests bullish conviction and vice versa.
The chart below shows periods of negative FPFR, especially during black swan events, which were typically followed by a price reversal. The exception was the Terra Luna de-peg, likely because it triggered a string of centralized platform bankruptcies, therefore acting as a headwind against positive market sentiment.
From 2022 onwards, the magnitude of the funding rate, both positive and negative, has significantly reduced. This would suggest less conviction in either direction compared to pre-2022.
Following the FTX scandal, the FPFR has been primarily negative, indicating general market bearishness and the possibility of price bottoming. Interestingly, the FTX scandal triggered the most extreme move in the funding rate since before 2022.
The post Research: On-chain metrics continue signaling a Bitcoin bottom appeared first on CryptoSlate.


