


Shiba Inu’s massive gains all across October may pare on potential bearish divergence signals and an overvalued relative strength index. Shiba Inu (SHIB) may see a pullback by almost 25%–35% on fears that the cryptocurrency’s excessive price rally in October has left it overvalued, a key indicator shows. Dubbed the Relative Strength Index (RSI), the […]
Shiba Inu’s massive gains all across October may pare on potential bearish divergence signals and an overvalued relative strength index.
Shiba Inu (SHIB) may see a pullback by almost 25%–35% on fears that the cryptocurrency’s excessive price rally in October has left it overvalued, a key indicator shows.
Dubbed the Relative Strength Index (RSI), the indicator measures the magnitude of an instrument’s recent price changes to evaluate its oversold and overbought conditions. The result can be anywhere between the number 0 and 100, with a reading below 30 showing the instrument’s oversold and above 70 showing its overbought status.
SHIB crossed above 70 on Oct. 3 and peaked around 94 three days later. Ideally, its overbought reading could have resulted in a price correction. But SHIB continued its rally as the monthly session progressed, eventually rising over 574% to its five-month high at $0.00004860 on Oct. 26.
Bearish divergence
On the other hand, Shiba Inu’s RSI slipped lower, thus creating a broad divergence between SHIB’s price and momentum. That reflected an underlying weakness in the cryptocurrency’s ongoing uptrend, raising possibilities of a pullback in the coming days.
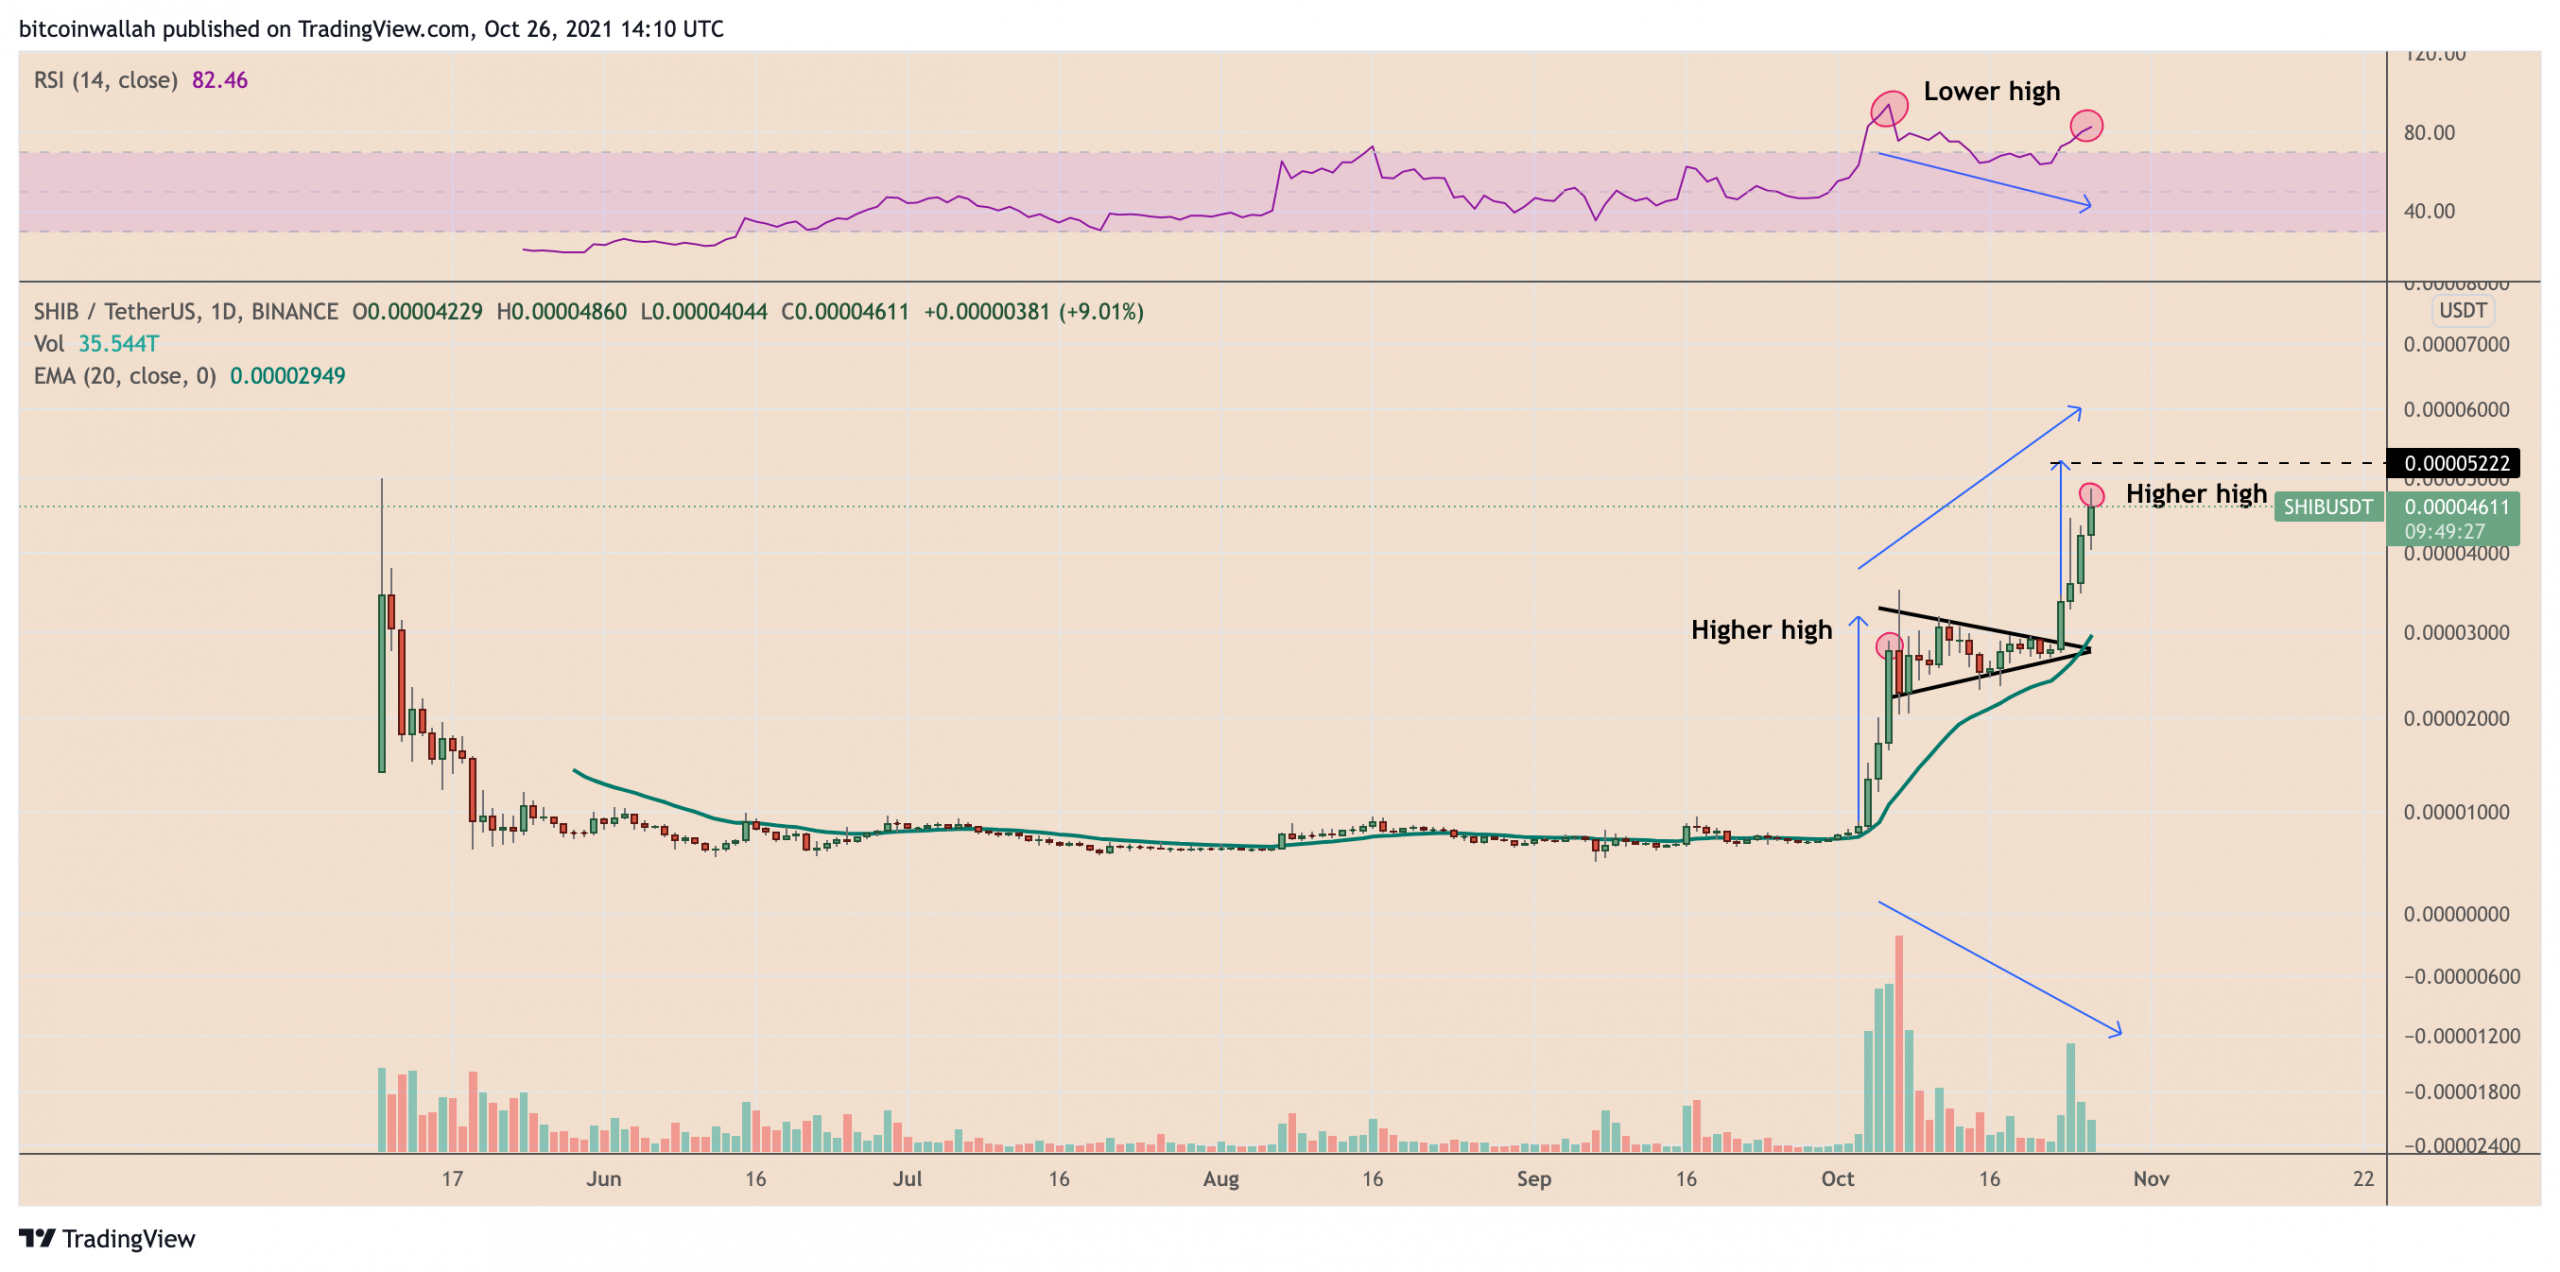
Additionally, the last three price candles on the Shiba Inu daily chart formed a sequence of higher highs at their close. But that coincided with declining trading volumes three days in a row, thus further validating the SHIB uptrend’s underlying weakness.
That does not mean an immediate price correction. According to the breakout that followed the formation of a Bull Pennant indicator, SHIB bulls appeared to have been eyeing $0.00005222 as their next upside target.
25%–35% SHIB price pullback?
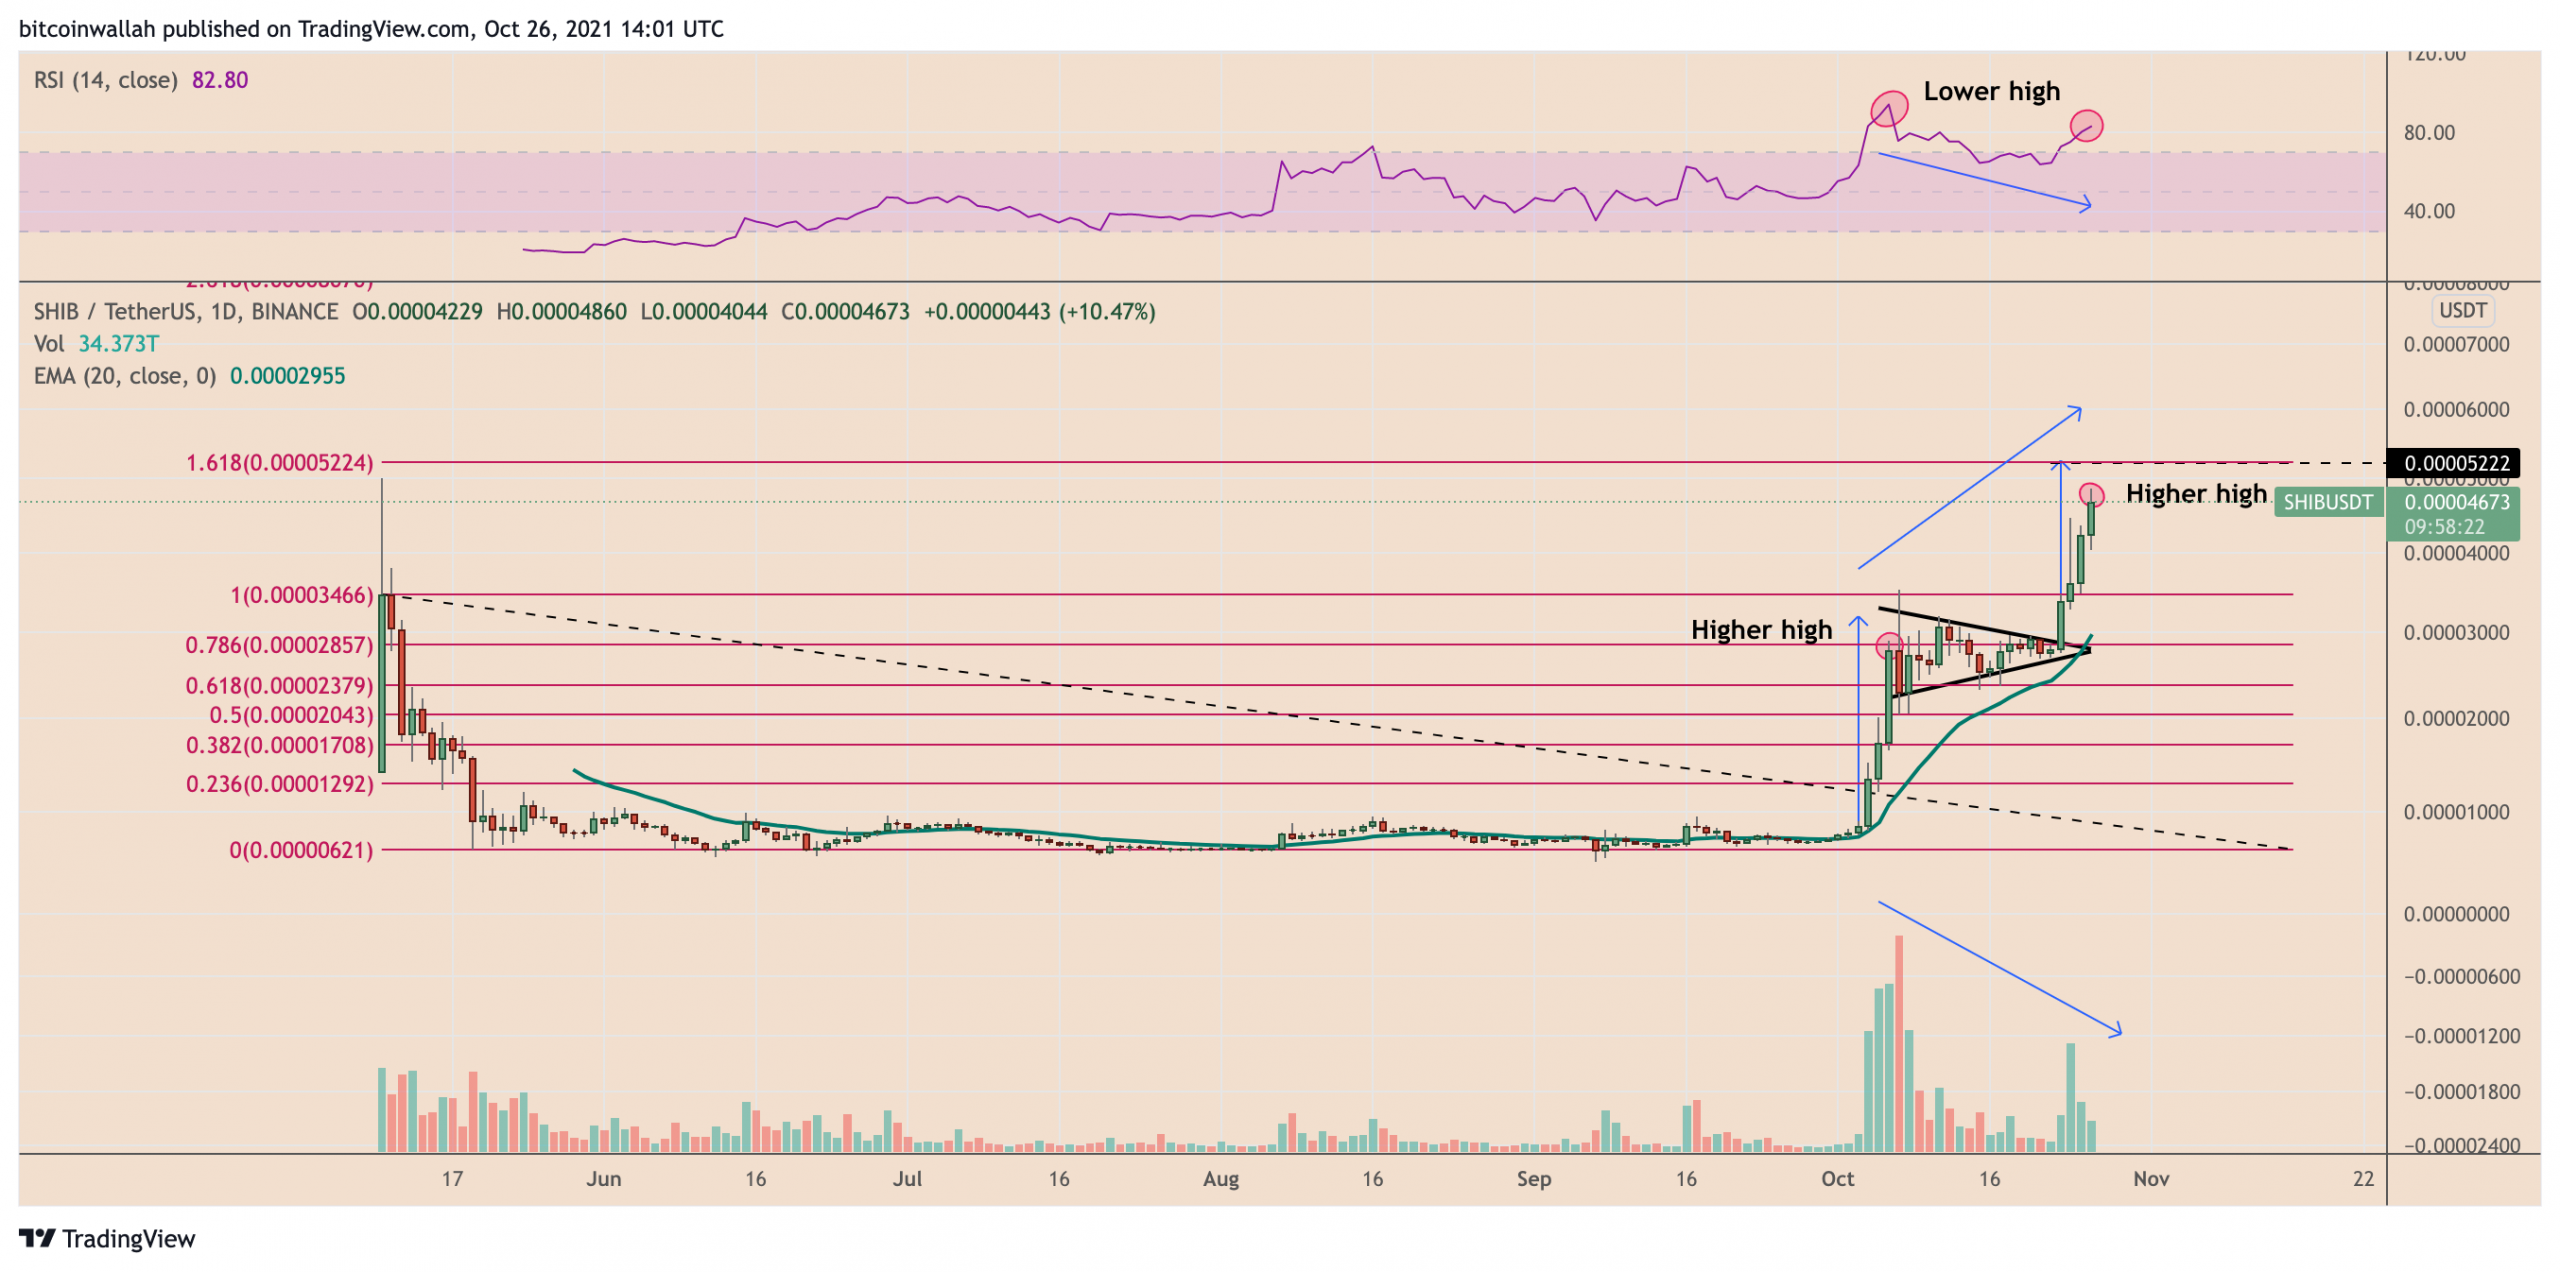
A Fibonacci Retracement graph between the Shiba Inu’s swing high of $0.00003466 and the swing low of $0.00000621 presented a string of levels that earlier served as support and resistance.
For instance, the 1.618 Fib line of the graph almost coincided with the Shiba Inu’s Bull Pennant target, just a two-notch upward at $0.00005224.
Thus, the resistance confluence of the 1.618 Fib line and Bull Pennant target raised SHIB’s potential to test the $0.00005222–$0.00005224 price range before undergoing a strong price correction.
Related: SHIB plummets 20% as Elon Musk reveals he owns none
In doing so, the cryptocurrency’s next downside target is near the 1.0 Fib line of $0.00003466, almost 25%–35% below the current price and $0.00005224.
On the other hand, a break above the 1.0 Fib line risks temporarily invalidating the entire bearish setup. That said, a bullish move may still make SHIB excessively overvalued based on its RSI readings, raising the potential of a correction in future sessions.
The views and opinions expressed here are solely those of the author and do not necessarily reflect the views of Cointelegraph.com. Every investment and trading move involves risk, you should conduct your own research when making a decision.


