


Stellar lumen price started a fresh increase above the $0.085 resistance zone against the US Dollar. XLM price is now trading above $0.085 and the 55 simple moving average (4-hours). There was a break above a key bearish trend line with resistance near $0.0875 on the 4-hours chart (data feed via Kraken). The pair could […]
- Stellar lumen price started a fresh increase above the $0.085 resistance zone against the US Dollar.
- XLM price is now trading above $0.085 and the 55 simple moving average (4-hours).
- There was a break above a key bearish trend line with resistance near $0.0875 on the 4-hours chart (data feed via Kraken).
- The pair could continue to rise if it stays above the $0.0870 and $0.0850 support levels.
Stellar lumen price is trading above $0.0880 against the US Dollar, similar to bitcoin. XLM price must stay above the $0.0850 support to rise further.
Stellar Lumen Price Analysis (XLM to USD)
After forming a base above the $0.080 level, stellar lumen price started a fresh increase against the US Dollar. The XLM/USD pair broke the $0.082 resistance zone to move into a positive zone.
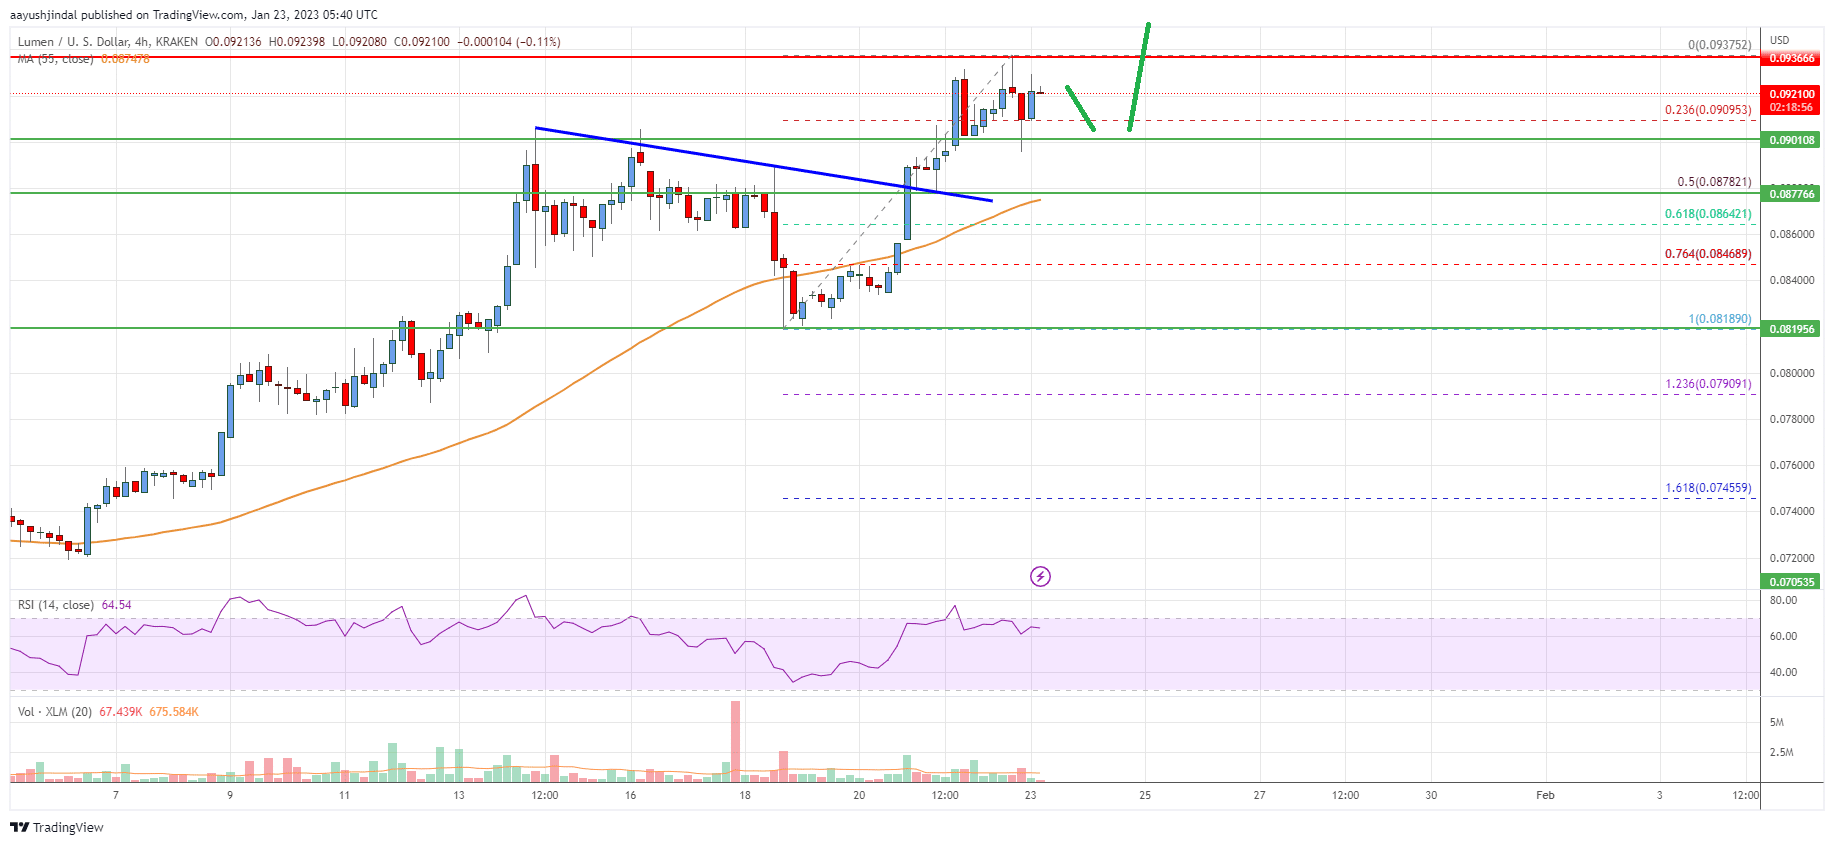
The price even broke the $0.0880 resistance and the 55 simple moving average (4-hours). There was a break above a key bearish trend line with resistance near $0.0875 on the 4-hours chart. The price is now trading comfortably above the $0.088 level.
On the upside, the price is facing resistance near the $0.0938 level. The next major resistance is near the $0.0950 level. A clear move above the $0.0950 level might send the price towards the $0.100 level.
Any more gains could lead the price towards the $0.1080 level or even $0.1120 in the coming days. An initial support on the downside is near the $0.0900 level. It is near the 23.6% Fib retracement level of the downward move from the $0.0818 swing high to $0.0937 low.
The next major support sits near the $0.0875 level or the 55 simple moving average (4-hours). It is close to the 50% Fib retracement level of the downward move from the $0.0818 swing high to $0.0937 low.
The main support is near the $0.085 zone. Any more losses could lead the price towards the $0.082 level in the near term, below which the price might even retest $0.080.
Stellar Lumen (XLM) Price
The chart indicates that XLM price is now trading above $0.0880 and the 55 simple moving average (4-hours). Overall, the price could continue to rise if it stays above the $0.0870 and $0.0850 support levels.
Technical Indicators
4 hours MACD – The MACD for XLM/USD is gaining momentum in the bullish zone.
4 hours RSI – The RSI for XLM/USD is now above the 50 level.
Key Support Levels – $0.0878 and $0.0850.
Key Resistance Levels – $0.0938, $0.0950 and $0.1000.
The post Stellar Lumen (XLM) Price Eyes Bullish Break Above $0.10 appeared first on Live Bitcoin News.


