


The Stellar (XLM) price shows short-term bearish signs, which could precede a decrease to $0.090 and possibly $0.083. Since May 2021, when it peaked at $0.798, the Stellar price had fallen in a descending wedge formation. Since the descending wedge is considered a bullish pattern, it is anticipated that it will frequently result in breakouts. […]
The Stellar (XLM) price shows short-term bearish signs, which could precede a decrease to $0.090 and possibly $0.083.
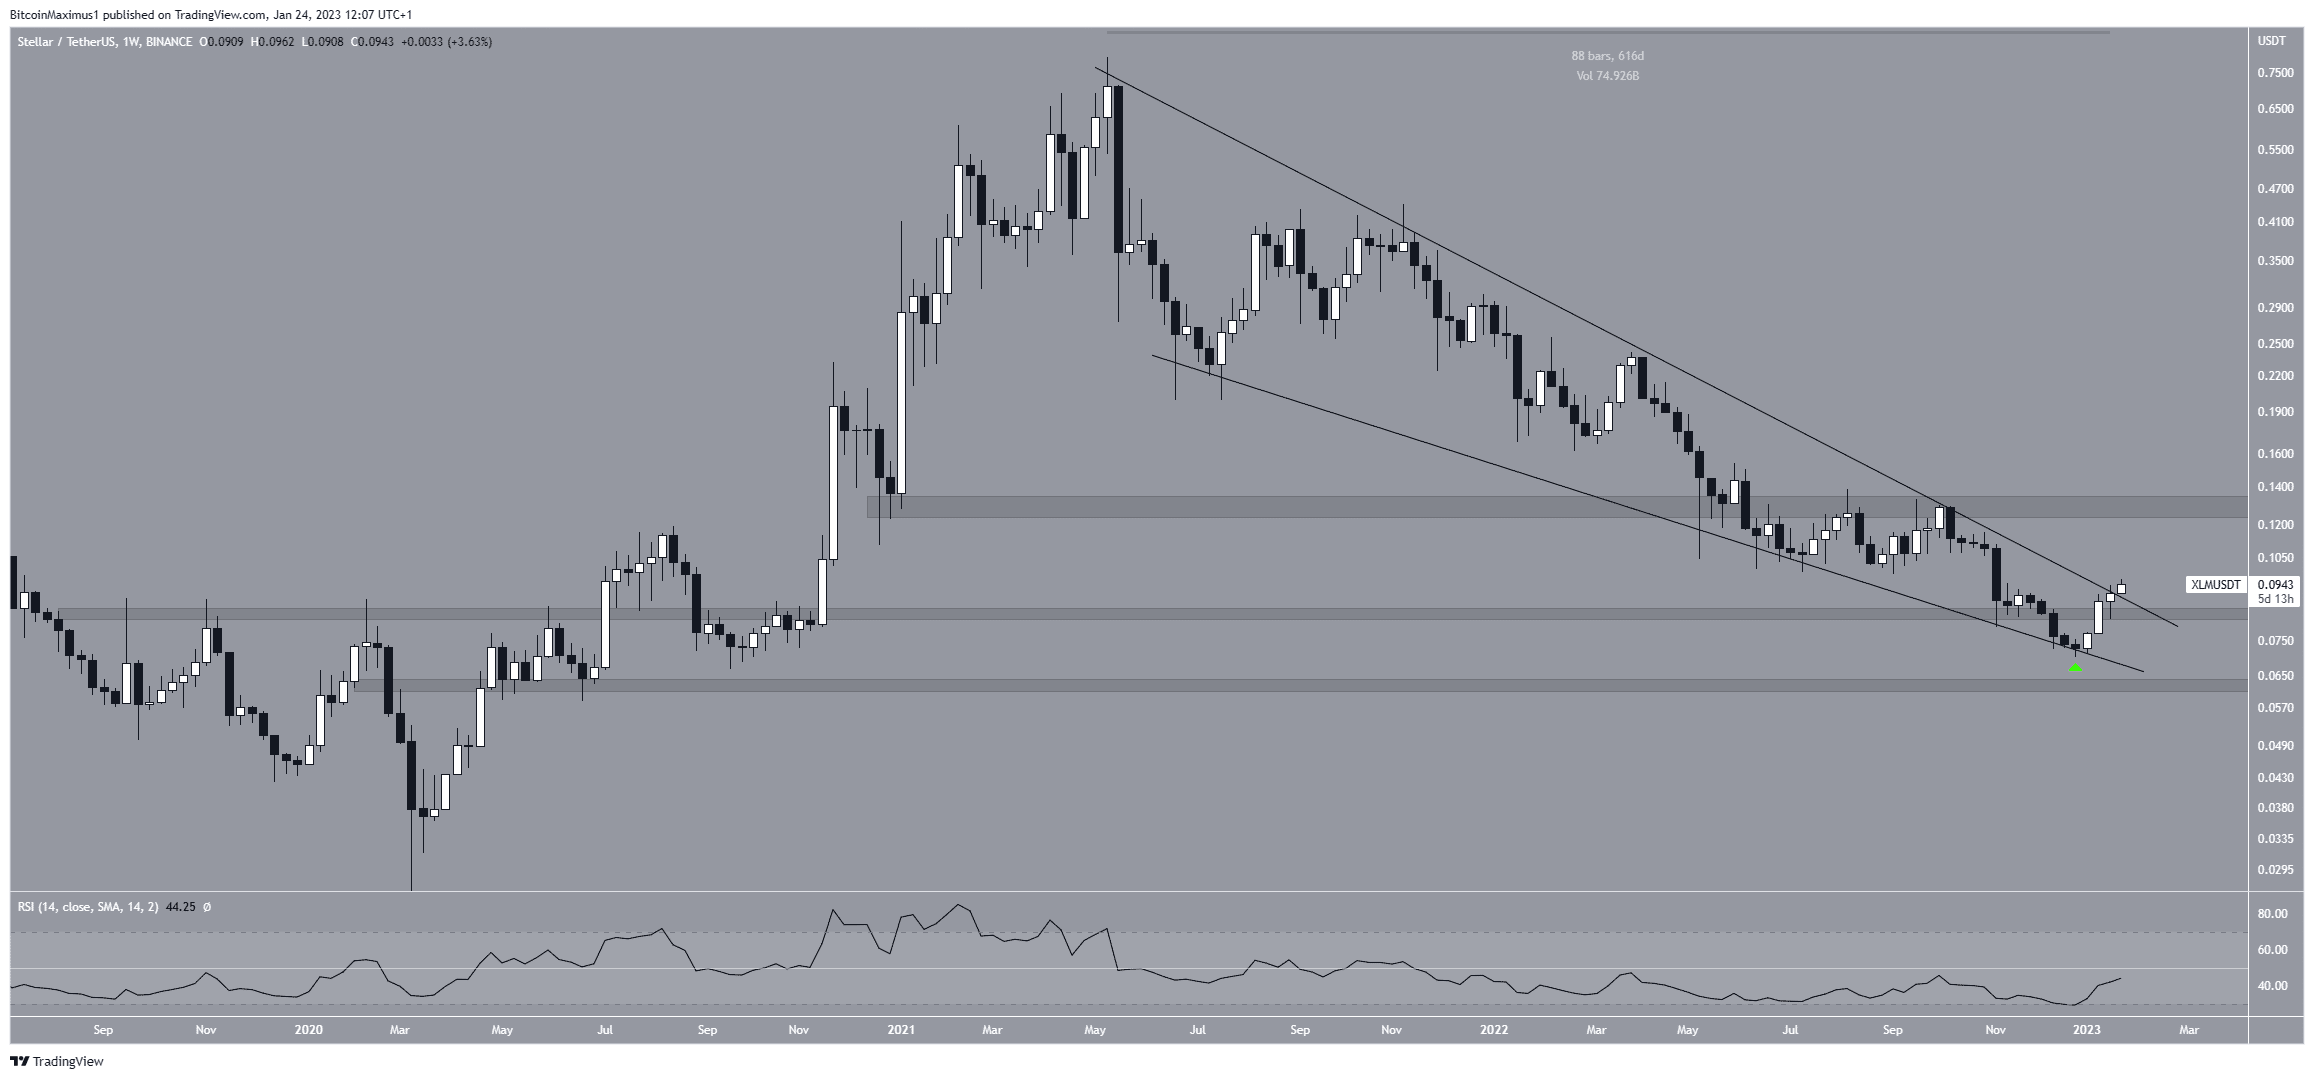
Since May 2021, when it peaked at $0.798, the Stellar price had fallen in a descending wedge formation. Since the descending wedge is considered a bullish pattern, it is anticipated that it will frequently result in breakouts.
The descending wedge is just one of many bullish readings in this time frame. When Stellar’s price initially declined below the $0.084 support area in Dec, it bounced at the wedge’s support line (green icon) and then recaptured it. Such a reclaim is viewed as a positive event because it invalidates the prior breakdown.
This week, the Stellar price is in the process of breaking out from the descending wedge. Since the wedge has been in place for 616 days, a breakout from it could lead to a significant upward movement. The closest resistance area is at $0.130.
If, however, the Stellar price fails to sustain the breakout, it could fall and re-test the $0.084 area once more.
The weekly RSI is increasing, but it is still below 50 and has not generated any bullish divergence. Therefore, more is needed to confirm the validity of the breakout.
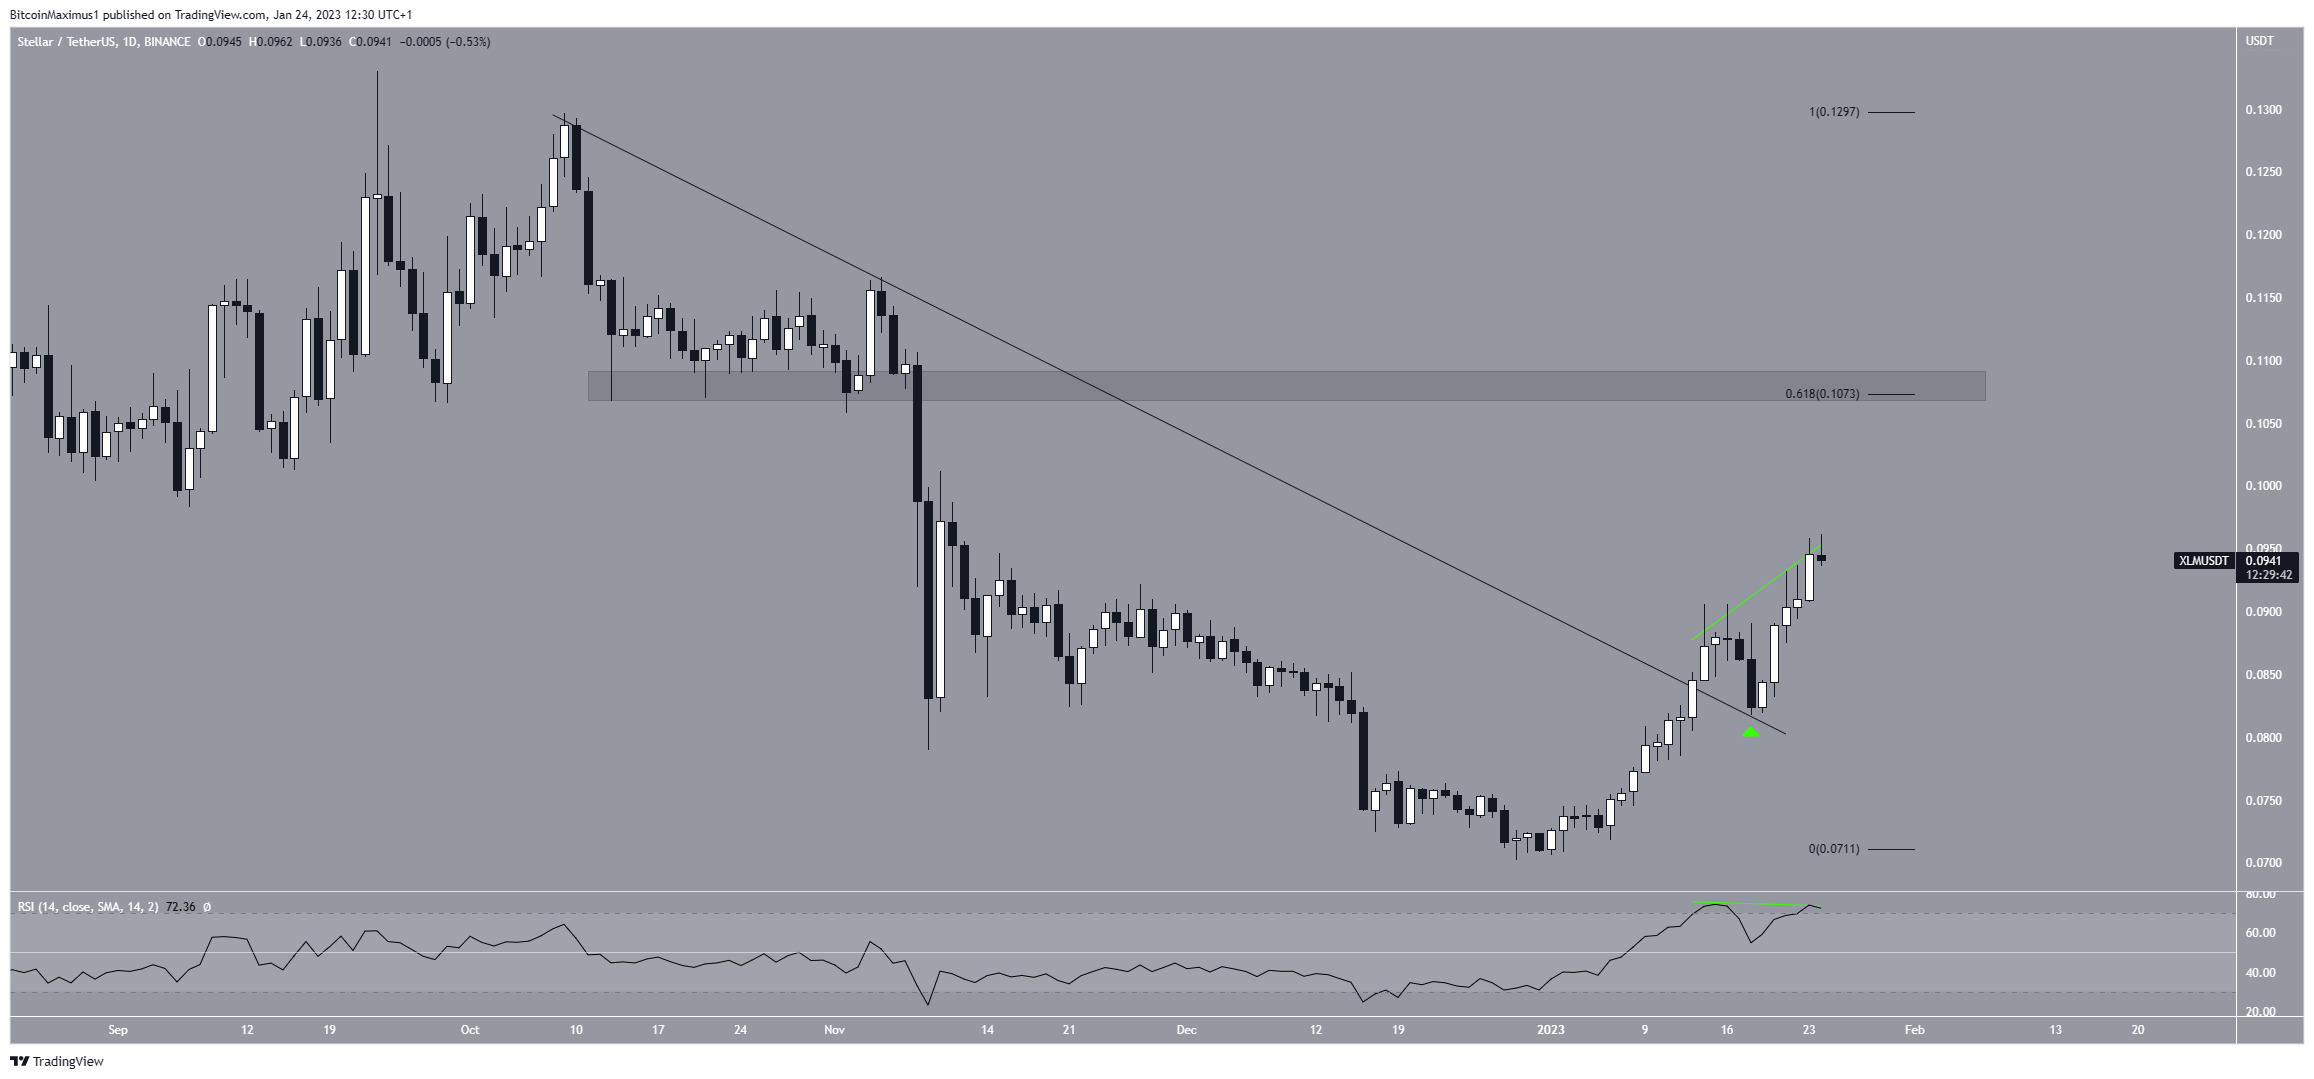
Stellar Price Breaks out From Short-Term Resistance
The technical analysis from the daily time frame shows that the Stellar lumens price broke out from a descending resistance line and validated it as support on Jan. 18 (green icon). It has increased since and is nearing the $0.107 resistance, which is both the 0.618 Fib retracement resistance level and a horizontal resistance area. Due to this confluence of resistances, it will be difficult for the Stellar price to break through.
Moreover, the daily RSI is in the process of generating bearish divergence, though it still needs to validate the trend line (green line).
Finally, the six-hour chart shows that the Stellar Lumens price is trading inside an ascending parallel channel. Such channels usually contain corrective structures.
Moreover, the XLM price is trading near the channel’s resistance line and has generated bearish divergence. These are all signs that a downward movement could occur.
Whether the Stellar price breaks down from the channel’s support line or bounces could determine the future trend. A breakdown would likely take it to the 0.5 Fib retracement level at $0.083, coinciding with the previously outlined long-term support area.
On the other hand, a breakout from the channel could take the price to $0.13.
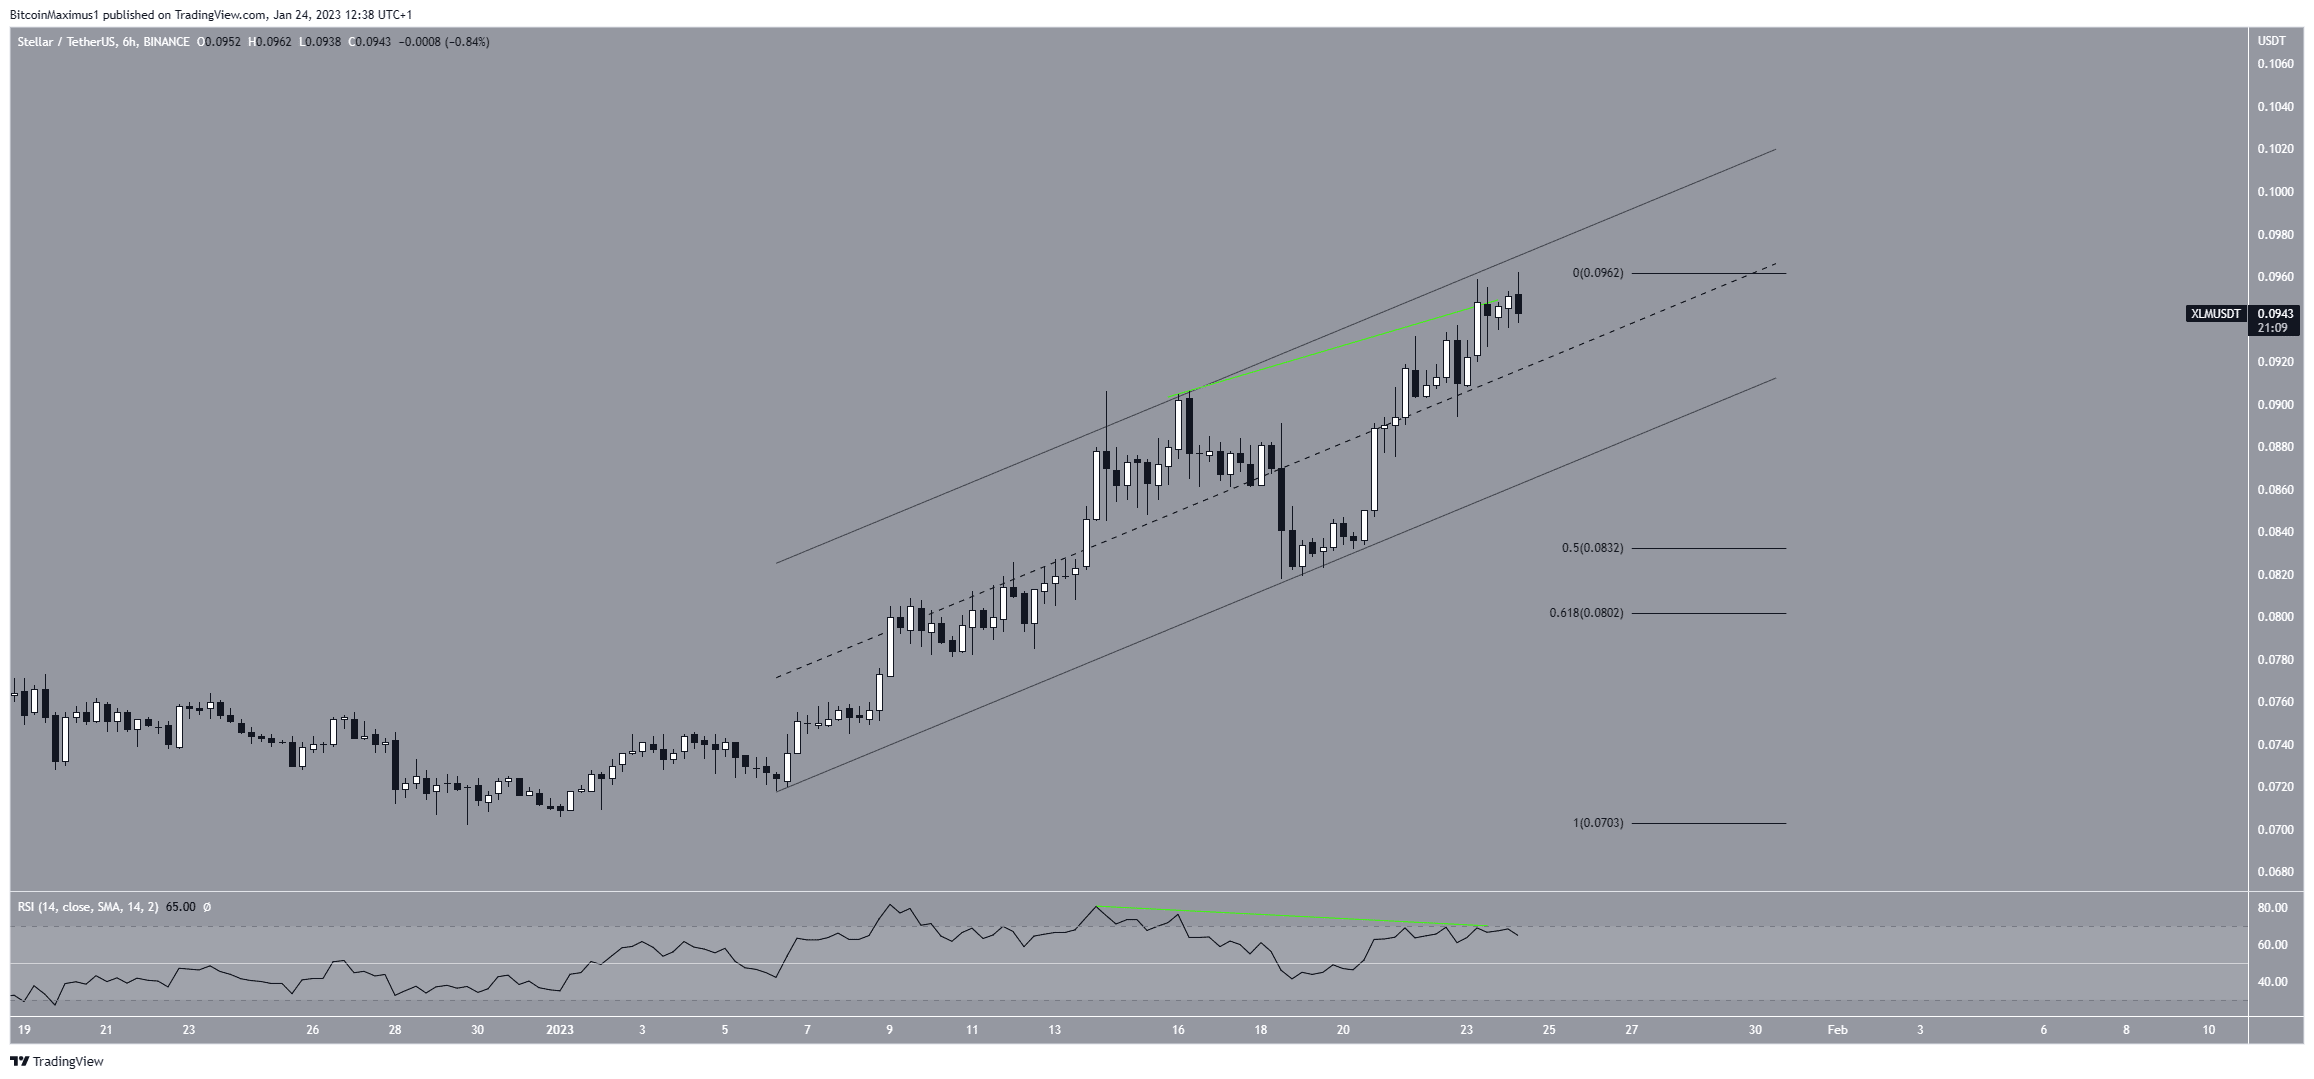
To conclude, the most likely Stellar price forecast is a decrease to the support line of the parallel channel and a potential breakdown to $0.083. On the other hand, a breakout from the channel would invalidate this bearish XLM price analysis and take the price to $0.13.
For BeInCrypto’s latest crypto market analysis, click here.
The post Stellar (XLM) Price Looks Ripe for Profit-Taking Before Higher Highs appeared first on BeInCrypto.


