


The Sui (SUI) price fell below an important support level that has been in place since the beginning of the month. This could be the catalyst for a sharp fall. Both the price action and indicator readings support the continuing decrease. So, a significant reversal would have to occur for the trend to be considered […]
The Sui (SUI) price fell below an important support level that has been in place since the beginning of the month. This could be the catalyst for a sharp fall.
Both the price action and indicator readings support the continuing decrease. So, a significant reversal would have to occur for the trend to be considered bullish.
Sui Price Finally Breaks Down
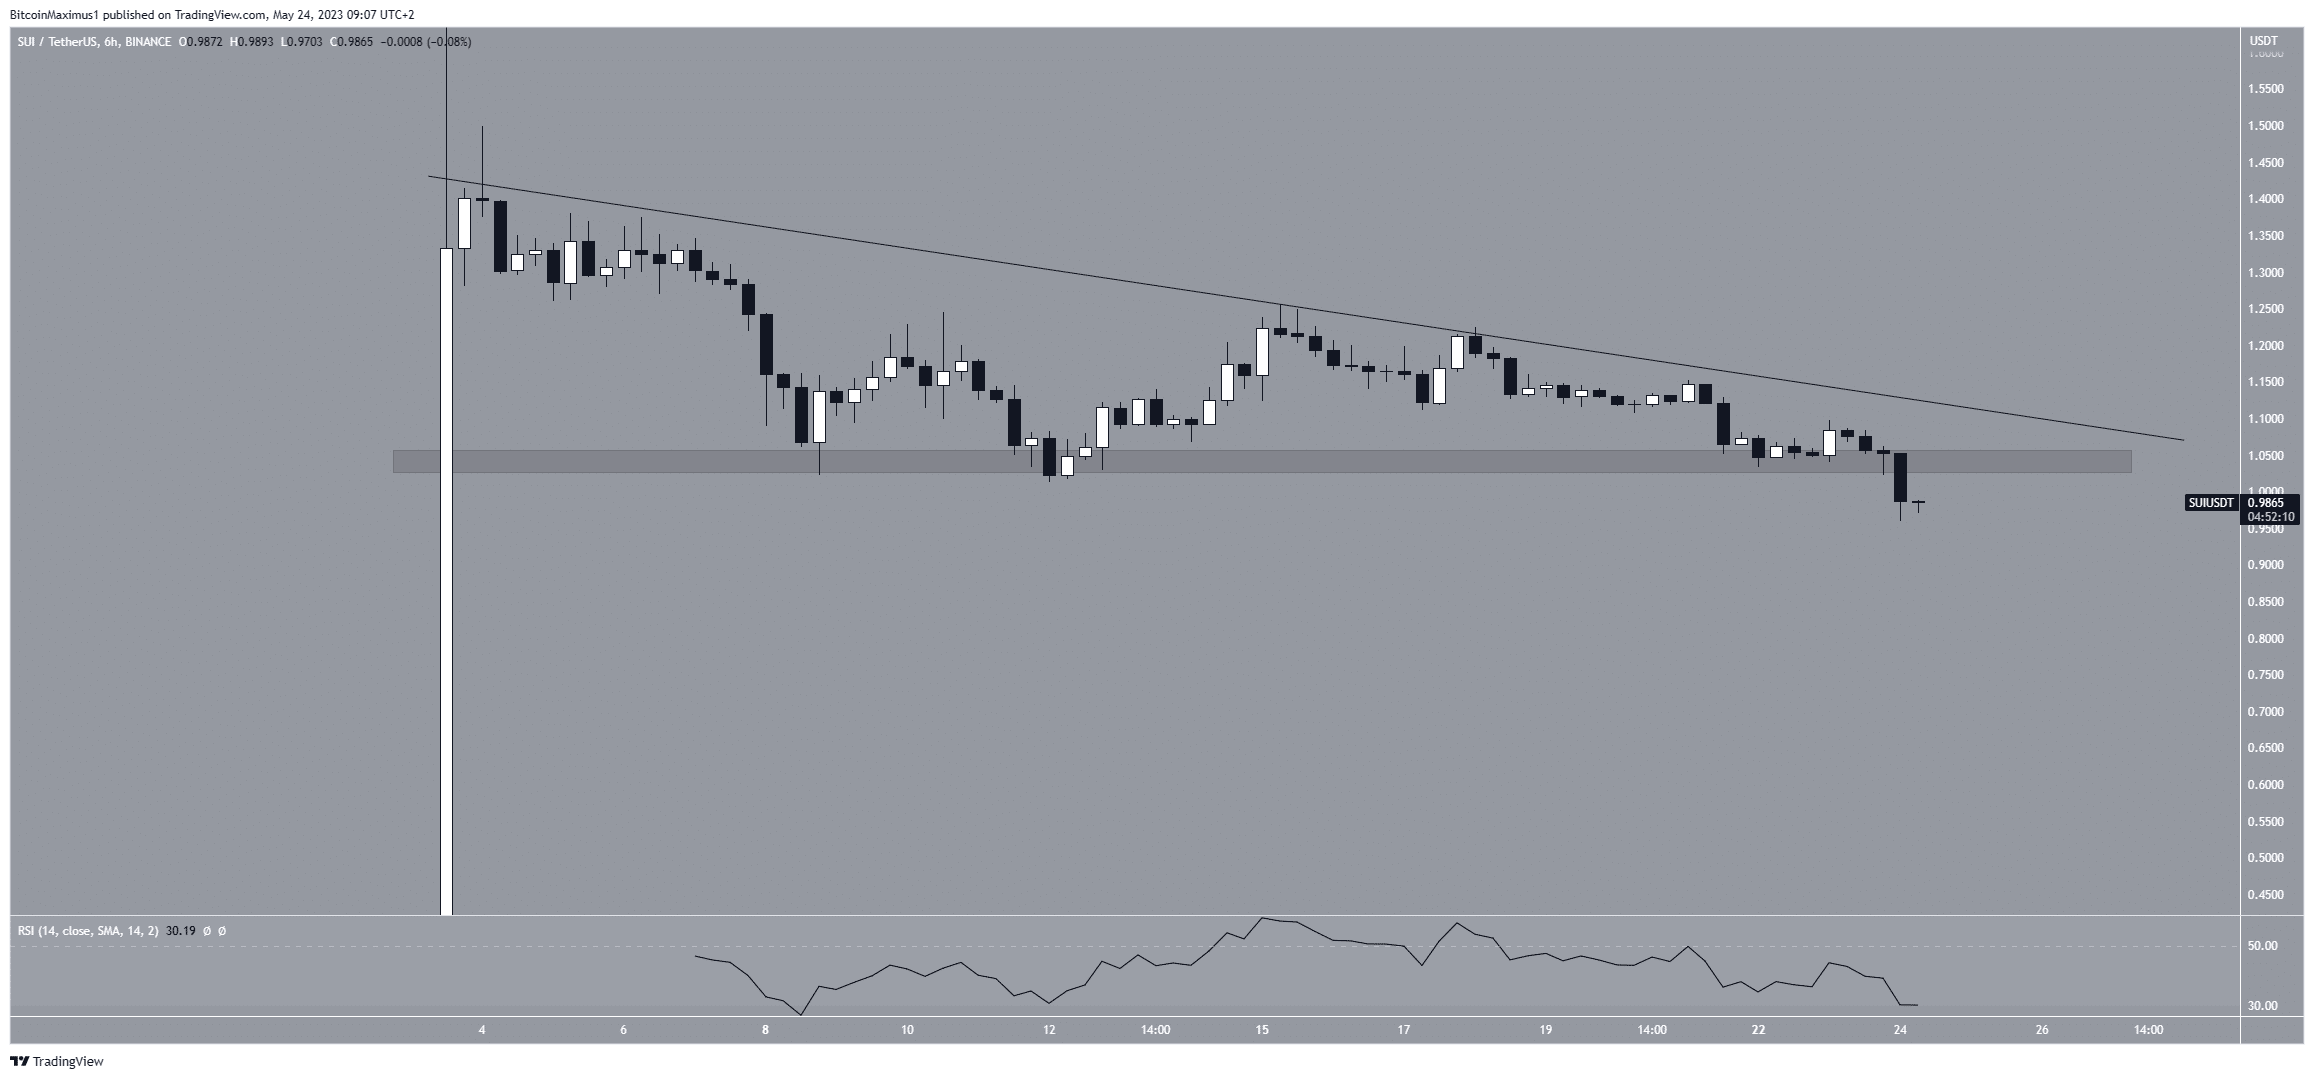
The SUI price has decreased under a descending resistance line since May 4. During this period, it bounced at the $1.05 horizontal support area numerous times.
The price action created a descending triangle, which is considered a bearish pattern. The descending triangle usually leads to breakdowns.
On May 24, the SUI price finally fell below the $1.05 horizontal area, confirming the breakdown from the triangle.
The six-hour RSI is bearish, supporting the continuation of the descent. By using the RSI as a momentum indicator, traders can determine whether a market is overbought or oversold and decide whether to accumulate or sell an asset.
If the RSI reading is above 50 and the trend is upward, bulls have an advantage, but if the reading is below 50, the opposite is true. The indicator is below 50 and decreasing, suggesting that the trend is bearish.
SUI Price Prediction: Is There Hope for a Reversal?
A closer look at the technical analysis from the 6-hour chart offers some hope for a reversal, but not enough to indicate that the trend is bullish.
The price may have traded inside a descending parallel channel since May 4. This is considered a bullish pattern, meaning that it will likely lead to a breakout. However, the channel’s support line has not been validated enough times.
If the channel is valid, the price now trades just above its midline. A close below the midline will confirm that a reversal will not transpire, but rather that the downward movement will continue.
If so, a breakdown that travels the entire previous pattern’s height (white) will take the SUI price to $0.70. This would also cause a breakdown from the parallel channel.
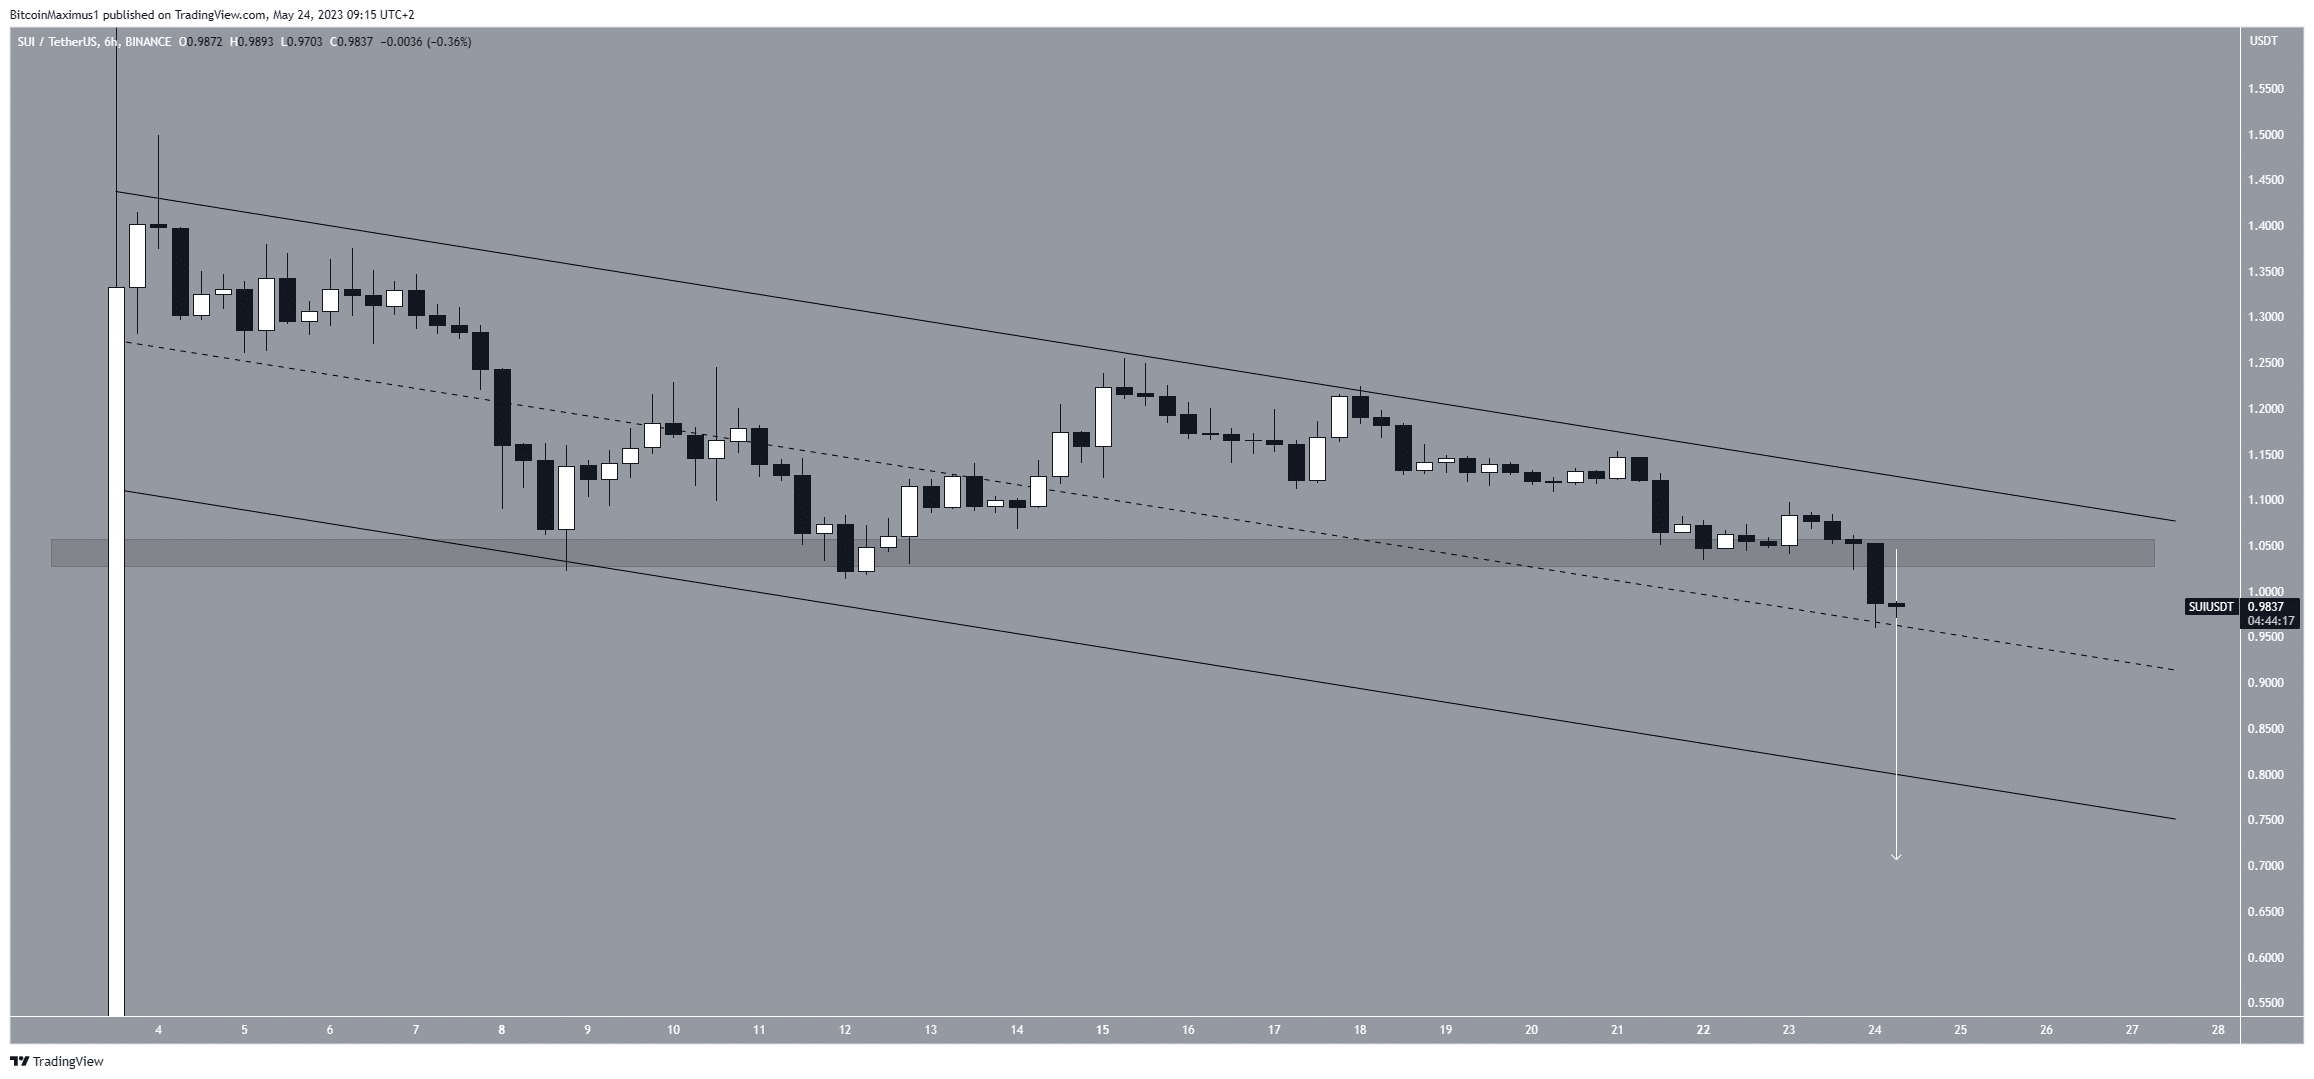
On the other hand, reclaiming the $1.05 area will invalidate this bearish SUI price prediction and indicate that the trend is still bullish.
In that case, the SUI price could increase toward the next closest resistance at $1.35.
For BeInCrypto’s latest crypto market analysis, click here.
The post Sui (SUI) Price Falls Below $1: Bearish Trend Ahead? appeared first on BeInCrypto.


