


Tron price started a fresh decline from the $0.0705 level against the US Dollar. TRX price is now trading below $0.0680 and the 55 simple moving average (4-hours). There is a key bearish trend line forming with resistance near $0.0678 on the 4-hours chart (data feed via Kraken). The pair could continue to move down […]
- Tron price started a fresh decline from the $0.0705 level against the US Dollar.
- TRX price is now trading below $0.0680 and the 55 simple moving average (4-hours).
- There is a key bearish trend line forming with resistance near $0.0678 on the 4-hours chart (data feed via Kraken).
- The pair could continue to move down if it breaks the $0.0660 support zone.
TRON price started a fresh decline below the $0.0680 against the US Dollar, similar bitcoin. TRX price could accelerate lower if there is a move below $0.0533.
Tron Price Analysis
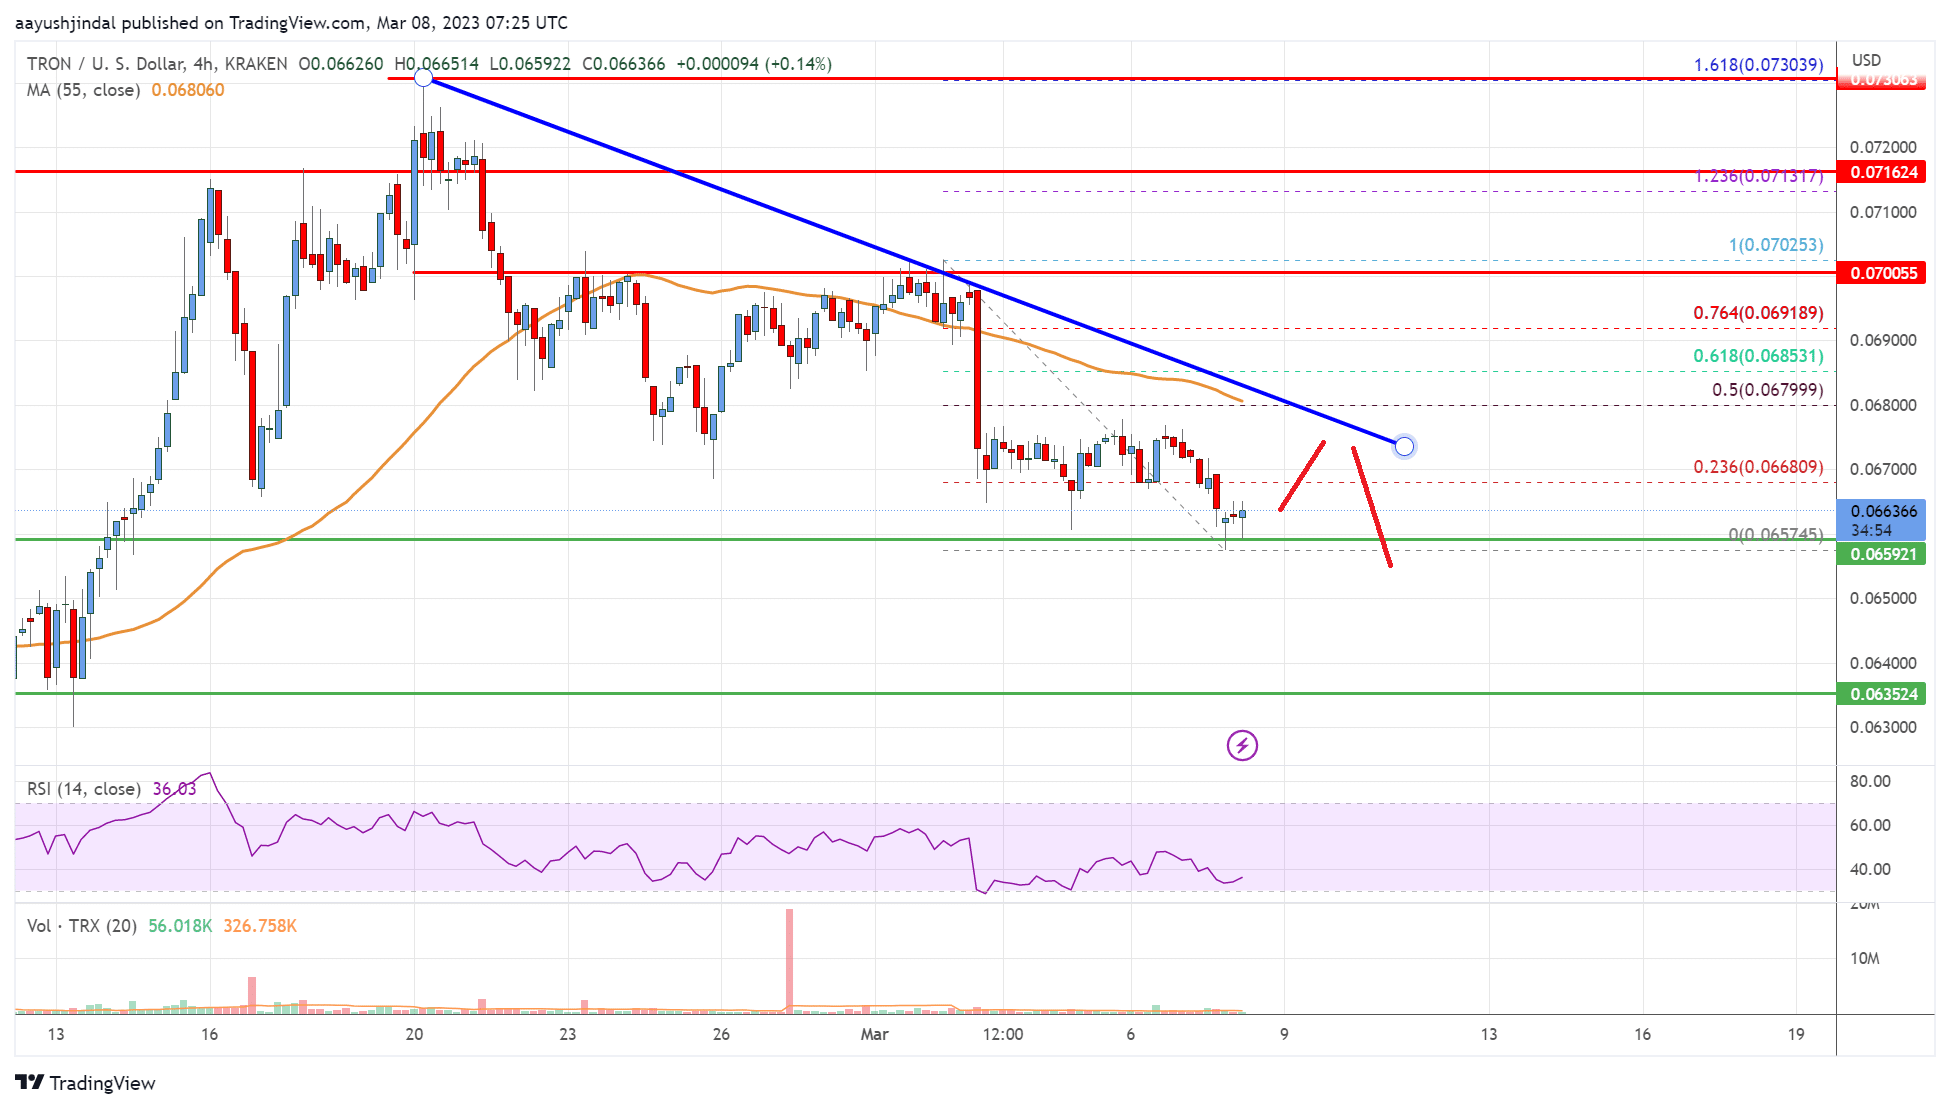
This past week, tron price started a steady decline from well above the $0.0700 resistance level against the US Dollar. TRX price struggled to gain pace for more gains and formed a top near $0.0702.
The price started a fresh decline below the $0.0680 level. There was a clear move below the $0.0665 level. A low is formed near $0.0657 and the price is now consolidating losses. The price is now trading below $0.0680 and the 55 simple moving average (4-hours).
On the upside, TRX is facing resistance near the $0.0668 level. It is near the 23.6% Fib retracement level of the downward move from the $0.0702 swing high to $0.0657 low.
The first major resistance is near the $0.0680 level. There is also a key bearish trend line forming with resistance near $0.0678 on the 4-hours chart. The trend line is near the 50% Fib retracement level of the downward move from the $0.0702 swing high to $0.0657 low.
A close above $0.0678 and $0.0680 is a must for a fresh increase. In the stated case, the price could rise towards the $0.0700 resistance in the near term.
On the downside, an initial support is near the $0.0660 level. The next major support is now forming near $0.0635. If there is a downside break below the $0.0635 support, the price might revisit the $0.0600 support. Any more losses might call for a move towards the $0.0550 zone in the near term.
Tron (TRX) Price
The chart indicates that TRX price is now trading below $0.0680 and near the 55 simple moving average (4-hours). Overall, the price could continue to move down if it breaks the $0.0660 support zone.
Technical Indicators
4 hours MACD – The MACD for TRX/USD is slowly gaining momentum in the bearish zone.
4 hours RSI – The RSI for TRX/USD is below the 50 level.
Key Support Levels – $0.0660 and $0.0635.
Key Resistance Levels – $0.0680, $0.070 and $0.0716.
The post Tron (TRX) Price Analysis: Risk of Downside Break Below $0.066 appeared first on Live Bitcoin News.


