


The Stellar (XLM) price could begin an upward movement if it manages to reclaim the $0.082 resistance area. The Stellar Lumens (XLM) price has fallen under a descending resistance line since its 2021 high of $0.798. The decrease led to a low of $0.070 in late December of the same year. No Bullish Signs Yet […]
The Stellar (XLM) price could begin an upward movement if it manages to reclaim the $0.082 resistance area.
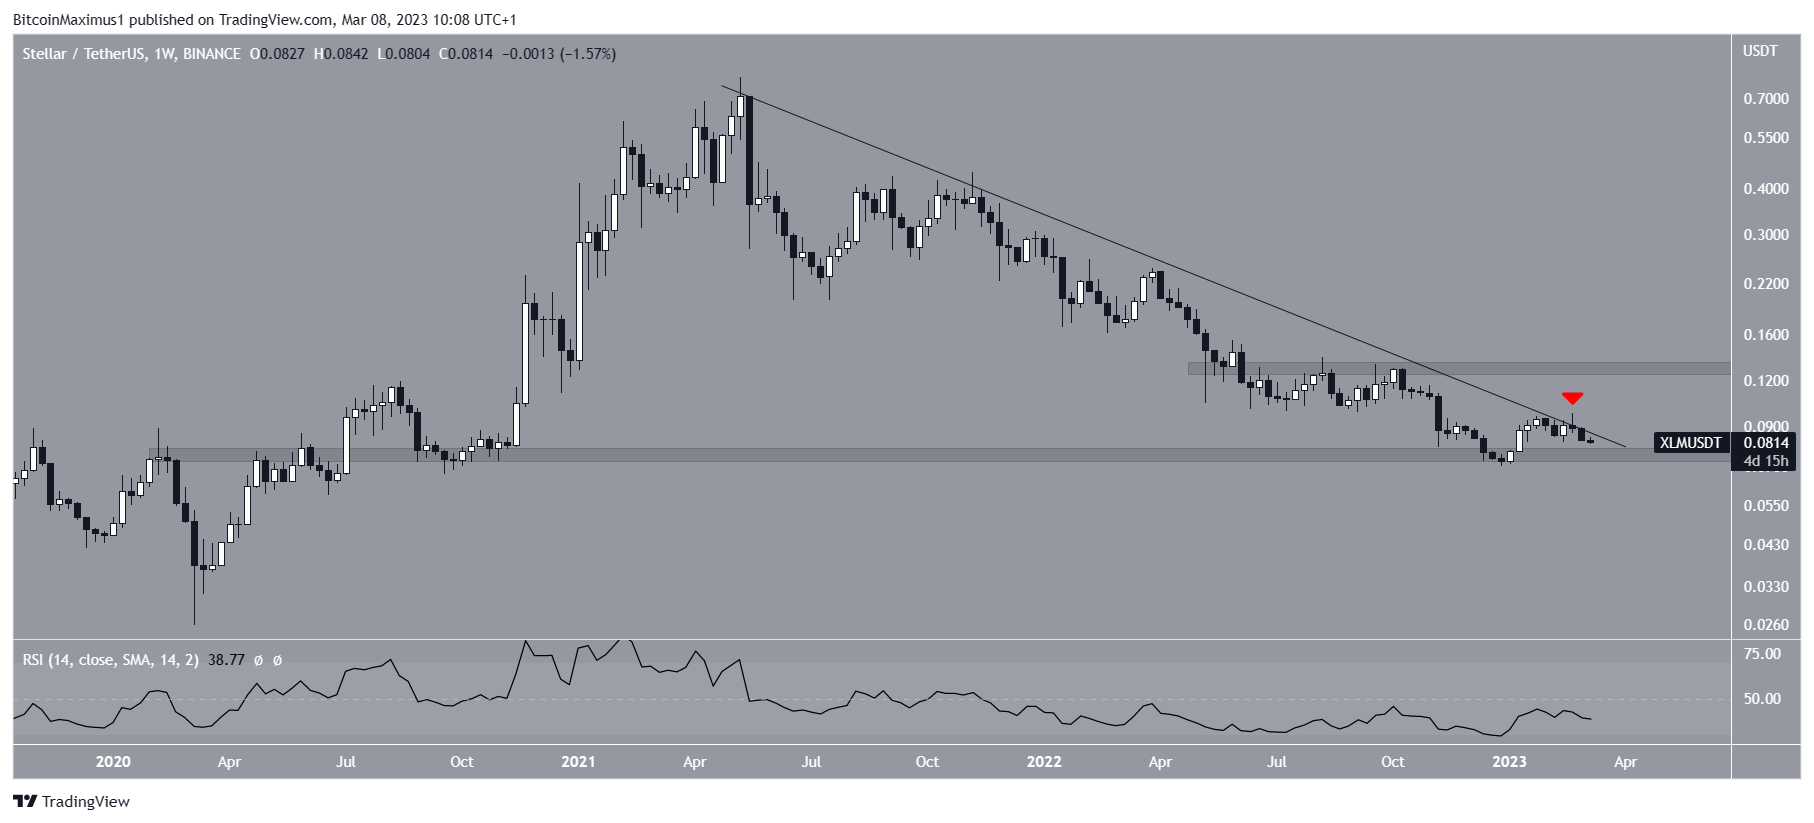
The Stellar Lumens (XLM) price has fallen under a descending resistance line since its 2021 high of $0.798. The decrease led to a low of $0.070 in late December of the same year.
No Bullish Signs Yet
While the XLM price has increased since, it failed to break out from the descending resistance line, instead creating a long upper wick (red icon). Moreover, the weekly RSI is still below 50.
Therefore, there are no signs in the weekly time frame that would suggest the trend is bullish. So, a drop to the $0.076 support area is expected.
On the other hand, if the price manages to break out, the next resistance would be at $0.130.
It is worth noting that the Stellar Network will be the title sponsor at Paris Blockchain Week between March 21-23.
Can Stellar (XLM) Reclaim Lost Support?
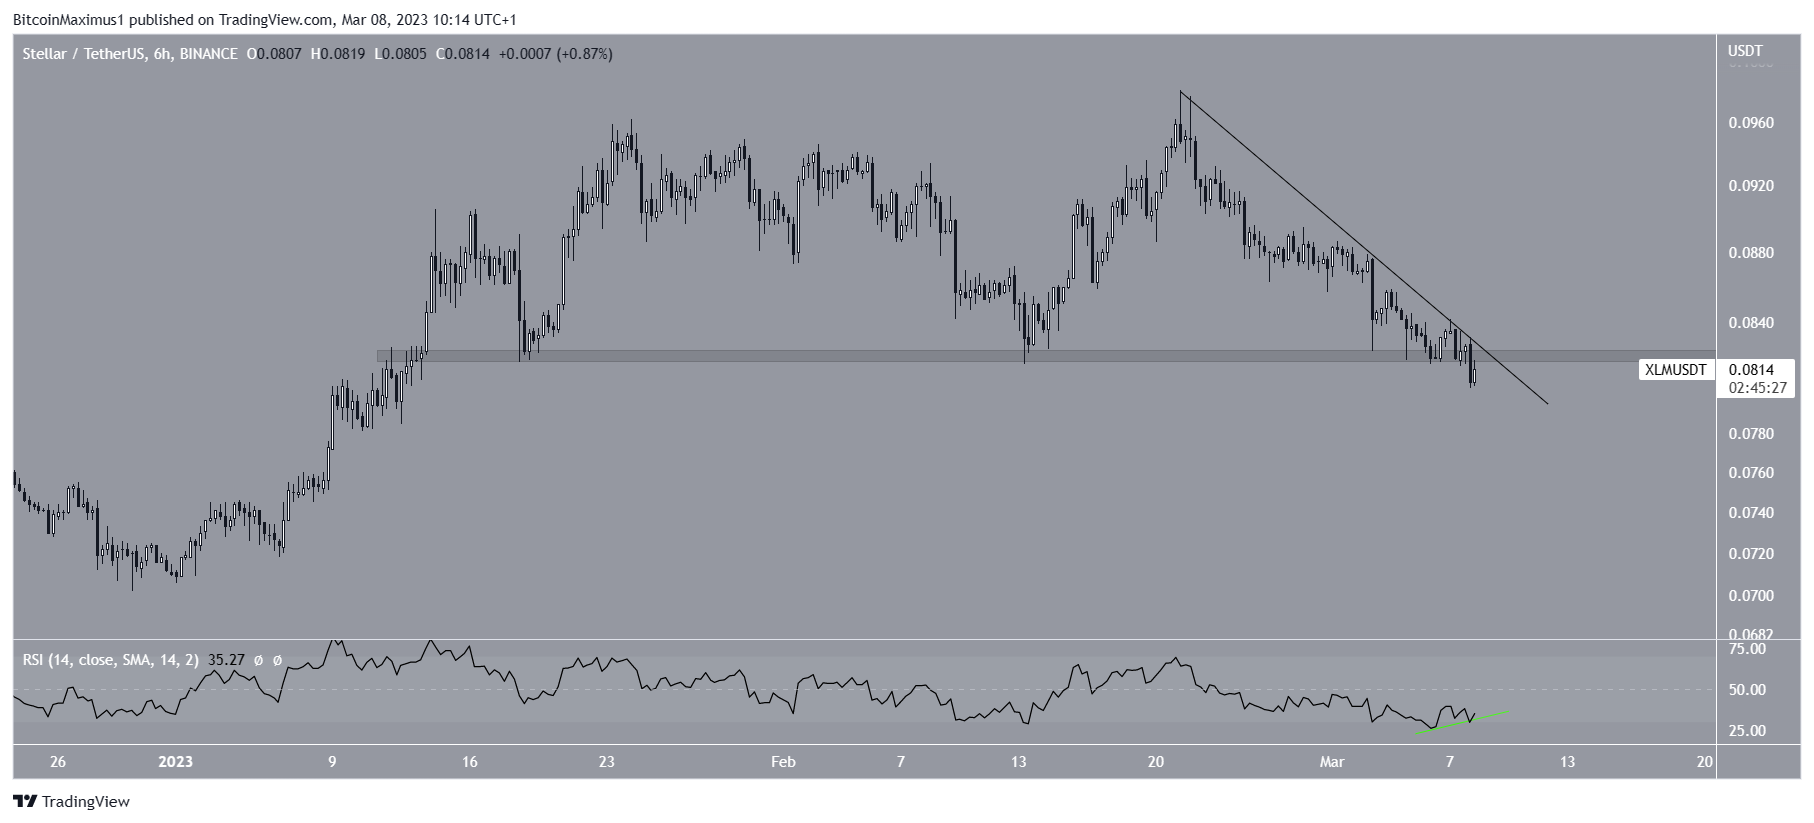
While the technical analysis from the weekly time frame is decisively bearish, the short-term six-hour one provides mixed readings.
On the bearish side, the Stellar price is falling underneath a descending resistance line and seemingly broke down below the $0.082 area, leading to the lowest price of the year. On the bullish one, the six-hour RSI has generated bullish divergence (green line), a sign that could precede an upward movement.
As a result, it is possible that the XLM price will reclaim this confluence of resistance levels and move upwards. If this occurs, it will also cause a breakout from the long-term descending resistance line.
To conclude, the future XLM price movement is undetermined. Whether the price reclaims the $0.082 area or gets rejected could help determine it. A breakout from the $0.082 area would also cause a breakout from the long-term descending resistance line, potentially leading to an increase toward $0.130. On the other hand, a rejection could lead to a drop toward $0.076.
For BeInCrypto’s latest crypto market analysis, click here.
The post What’s Happening With Stellar (XLM) Price Action? appeared first on BeInCrypto.


