


The Chainlink (LINK) price broke out from a descending resistance line and is on its way toward the $9.30 resistance area. Since May 2021, the Chainlink price has traded inside a long-term range of $5.80 and $9.30. Both the range’s top and bottom have been validated sufficient times. More recently, the LINK price bounced at […]
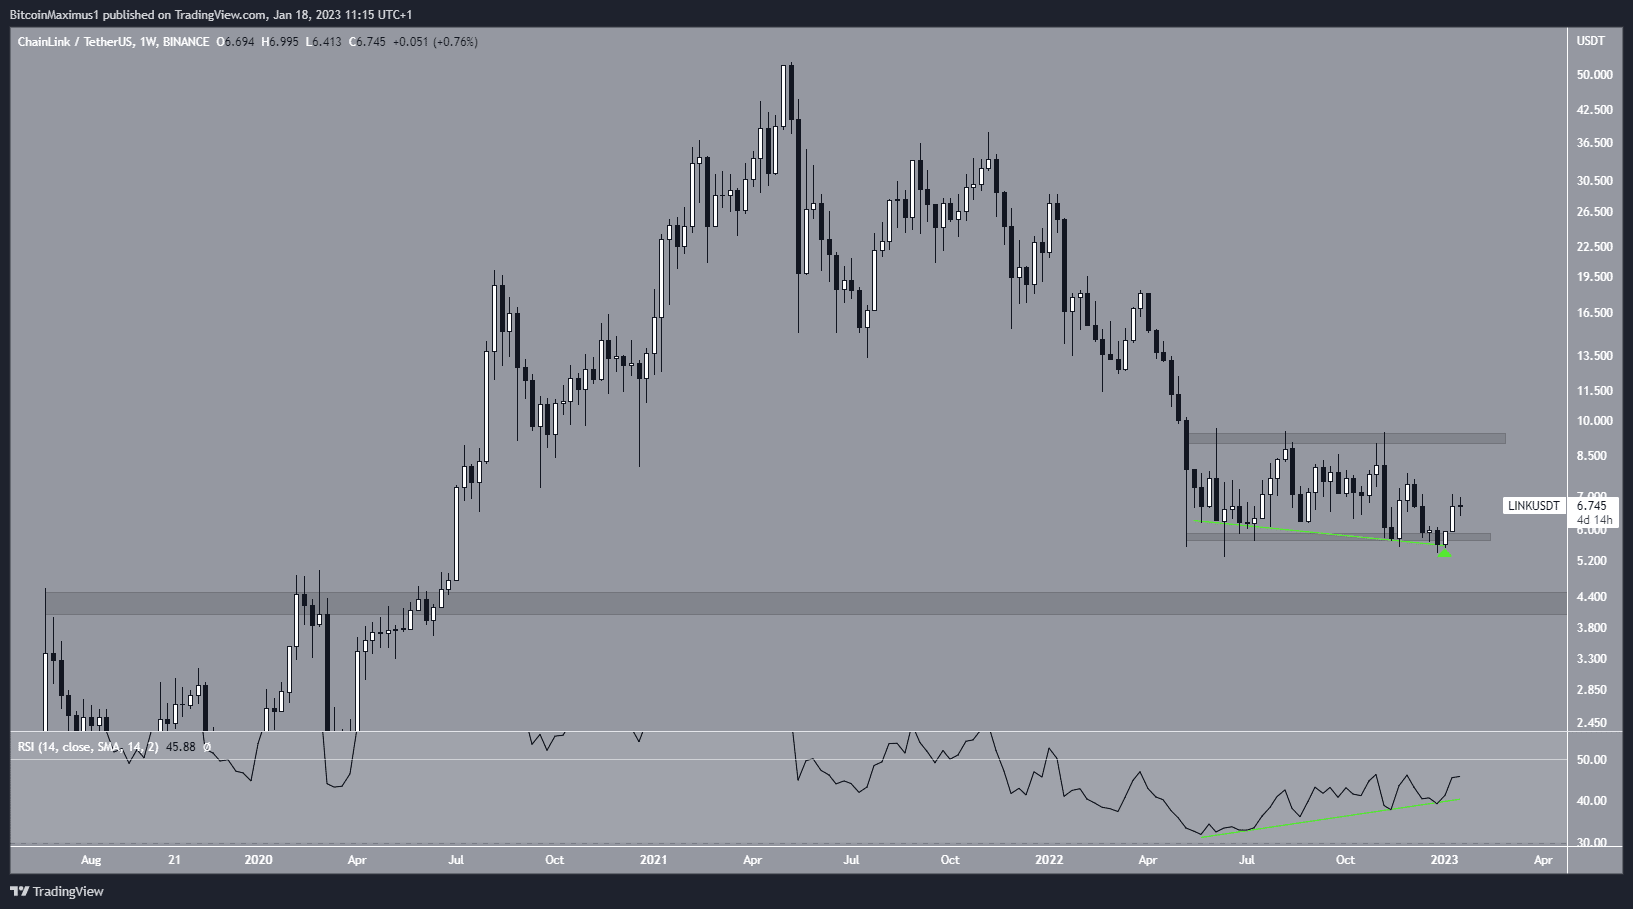
The Chainlink (LINK) price broke out from a descending resistance line and is on its way toward the $9.30 resistance area.
Since May 2021, the Chainlink price has traded inside a long-term range of $5.80 and $9.30. Both the range’s top and bottom have been validated sufficient times.
More recently, the LINK price bounced at the bottom of the range in the beginning of Jan. (green icon) and has been increasing since.
The upward movement was preceded by bullish divergence in the weekly RSI, which developed for over 7 months. It is worth mentioning that this is the first time that such a divergence is present in the weekly time frame. An RSI movement above 50 would confirm that the trend is bullish.
If the upward movement continues, the Chainlink price would be expected to reach the $9.30 resistance area.
On the other hand, a weekly close below the $5.80 area would take the price toward the next support at $4.30.
Chainlink Price Breaks out From 60-Day Resistance
The technical analysis from the daily time frame shows that the Chainlink price broke out from a 60-day descending resistance line on Jan. 7. This catalyzed the current upward movement.
However, the price faces two hurdles on its way to the $9.30 range high.
Firstly, there is the 0.382 Fib retracement resistance level at $6.96. The level already rejected the price on Jan. 14 and has created several long upper wicks (red icons).
Next, there is the 0.618 Fib retracement resistance level at $7.93. This is the final resistance before the range high.
If the LINK price successfully reclaims and then validates the $6.96 level as support, it would go a long way in suggesting that it will reach the range high.
On the other hand, a rejection could lead to a re-test of the $6 level.
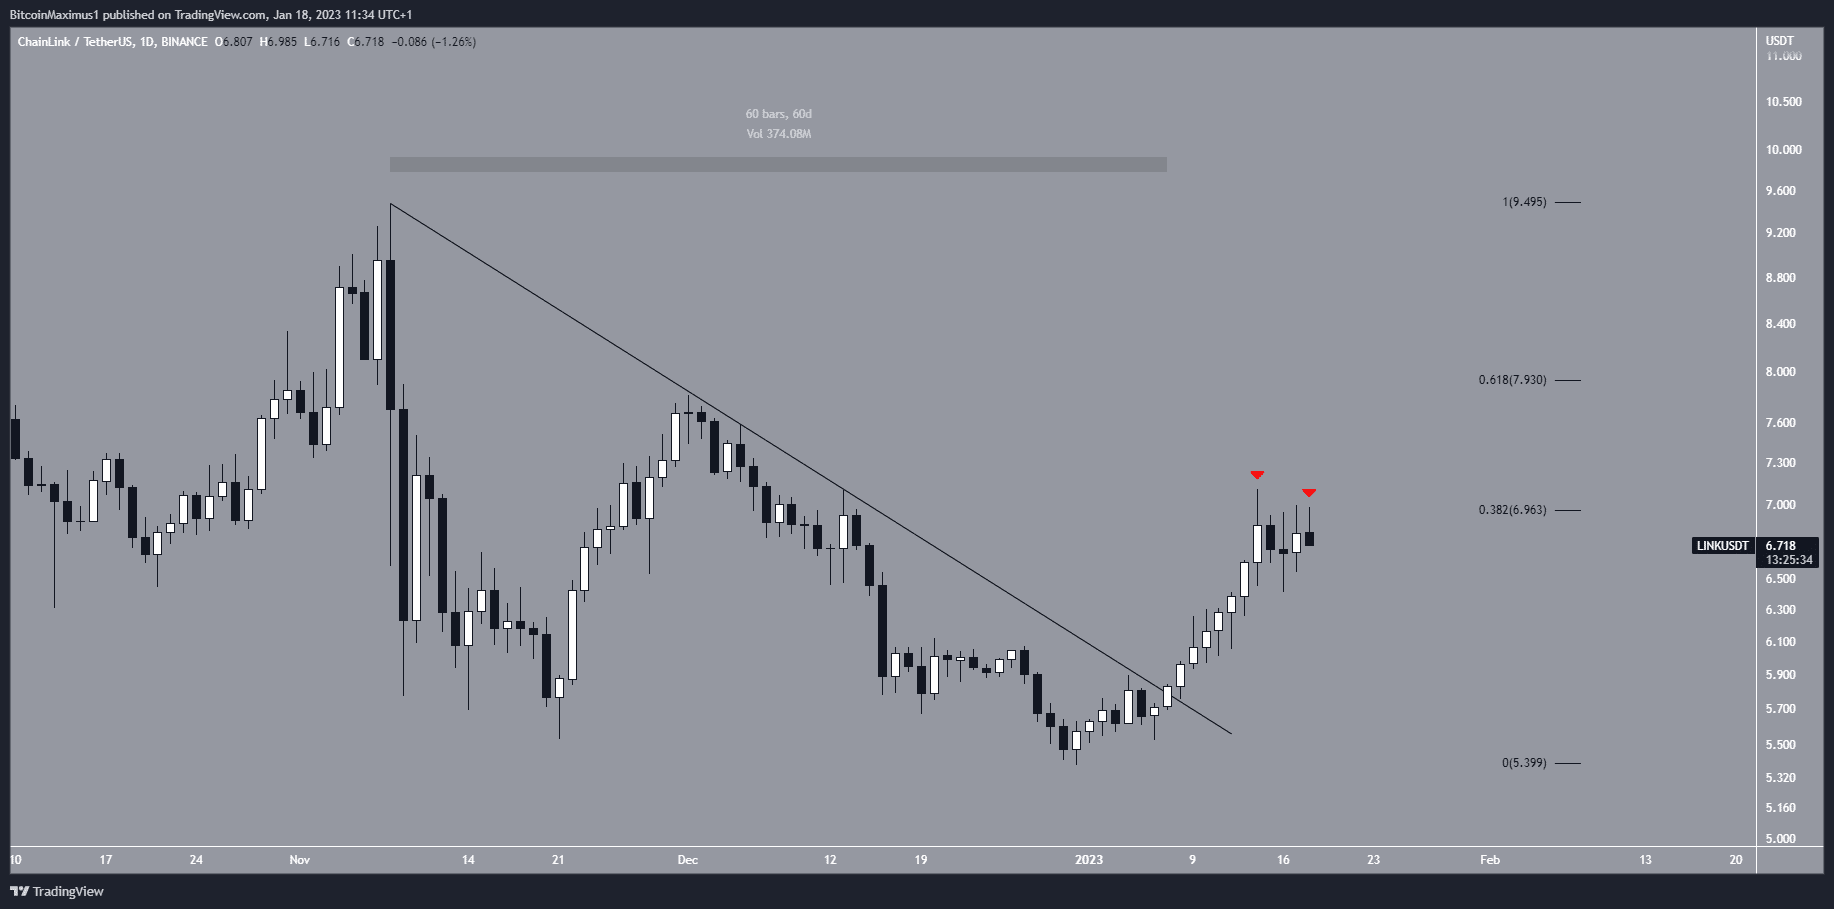
To conclude, while an increase toward the range high at $9.30 is the most likely LINK price analysis, there are two resistances left to clear until the price gets there. Failure to clear them could lead to a re-test of the $6 level.
For BeInCrypto’s latest crypto market analysis, click here.
The post Will Chainlink (LINK) Price Move Even Higher in January? appeared first on BeInCrypto.


