


The Polygon (MATIC) price began a bounce on May 12 but has not confirmed a bullish reversal yet. The readings from both long- and short-term timeframes suggest that more downside is expected and that the price will reach a local bottom soon. Polygon Price Breaks Down From Long-Term Structure The technical analysis from the weekly […]
The Polygon (MATIC) price began a bounce on May 12 but has not confirmed a bullish reversal yet.
The readings from both long- and short-term timeframes suggest that more downside is expected and that the price will reach a local bottom soon.
Polygon Price Breaks Down From Long-Term Structure
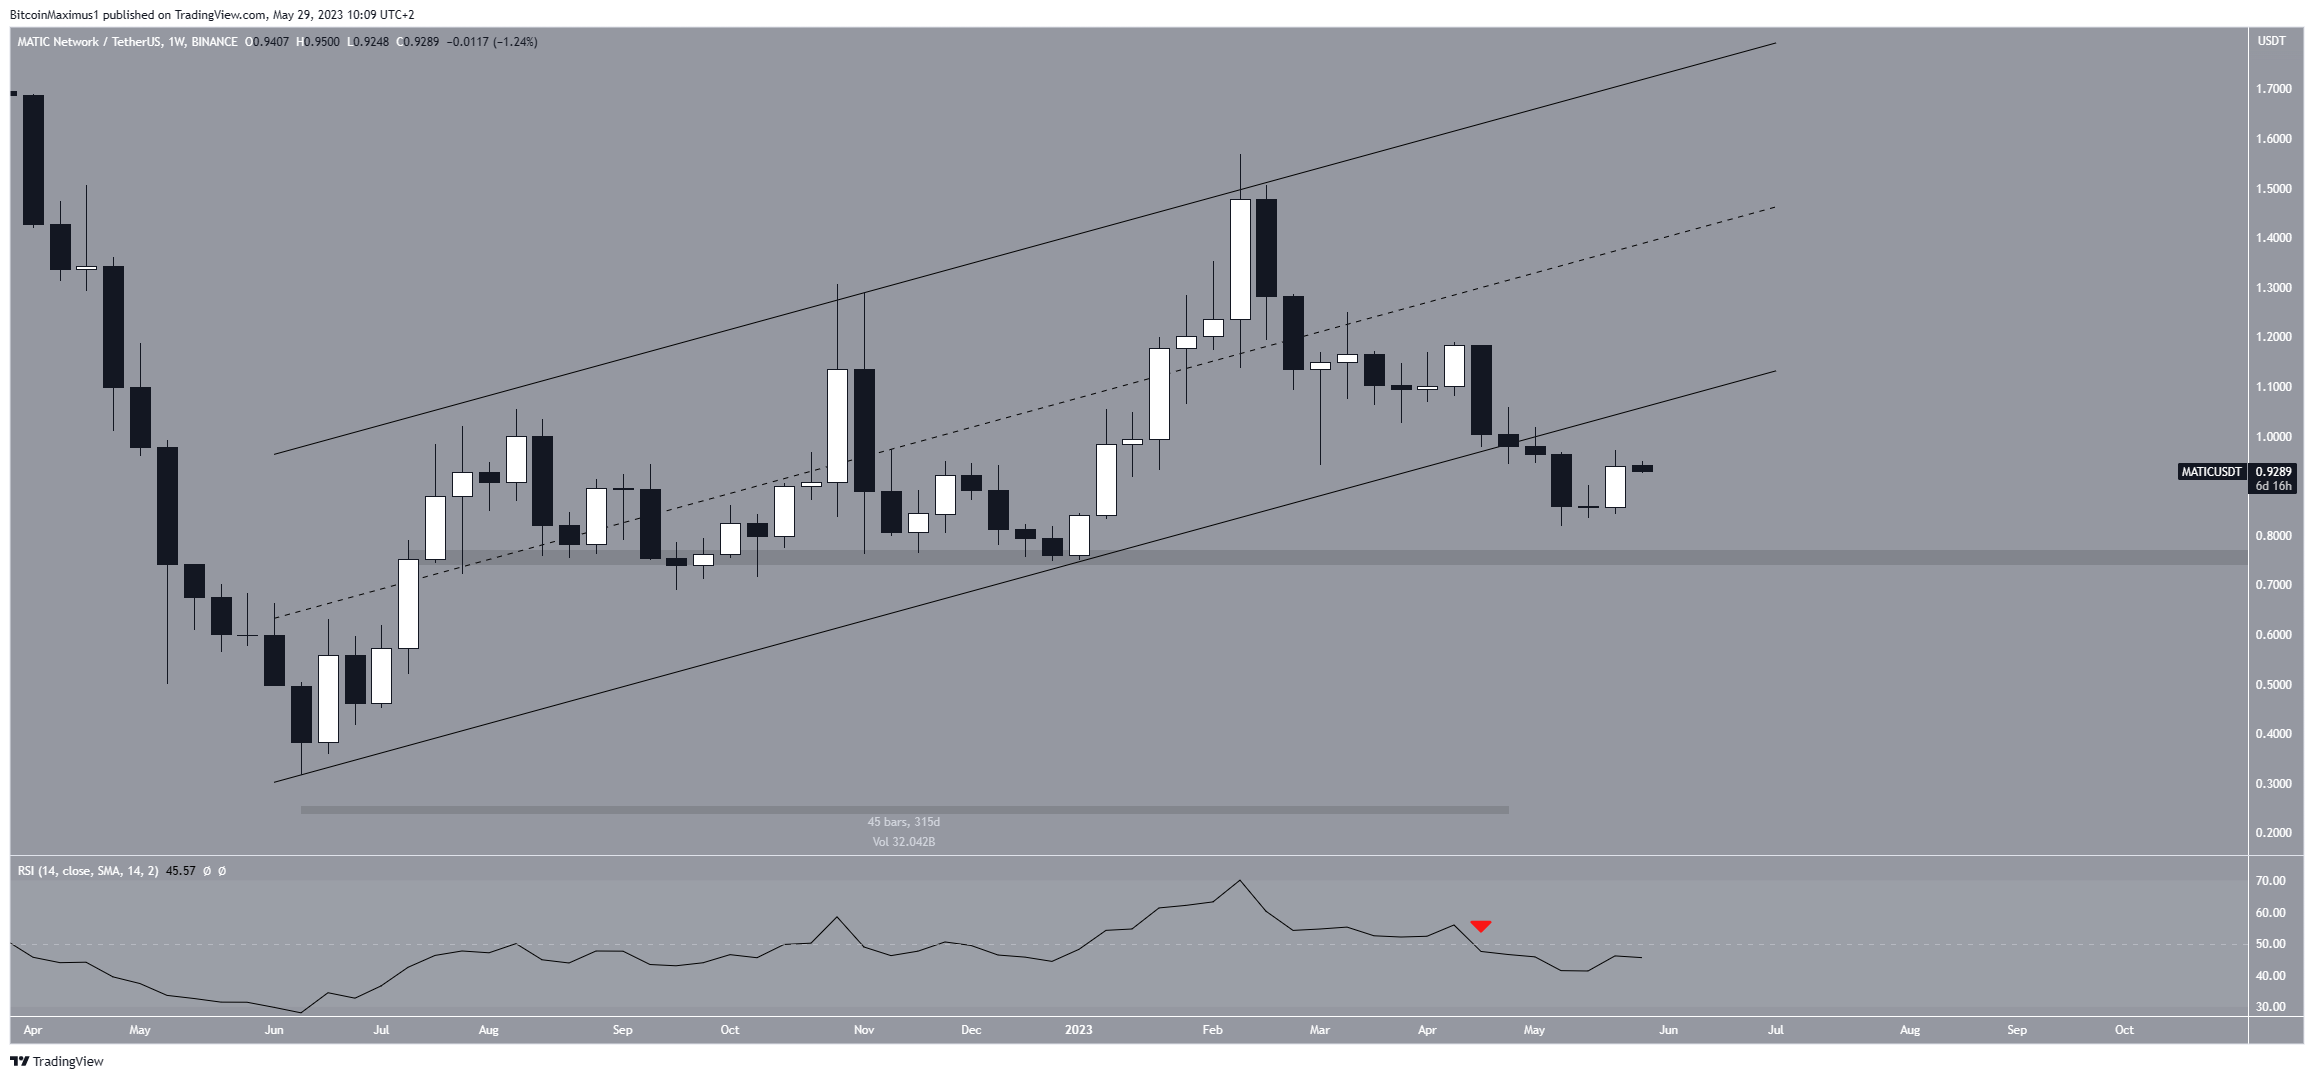
The technical analysis from the weekly time frame provides a bearish outlook for the Polygon price. The main reason for this is that the price broke down from a long-term ascending parallel channel in April 2023.
Previously, the channel had existed for 315 days. Breakdowns from such long-term structures usually lead to significant bearish trend reversals.
The next reason for the bearish outlook is the weekly Relative Strength Index (RSI) drop below 50 (red icon). Market traders use the RSI as a momentum indicator to identify overbought or oversold conditions, and to decide whether to accumulate or sell an asset.
Readings above 50 and an upward trend indicate that bulls still have an advantage, whereas readings below 50 suggest the opposite. The RSI breakdown coincided with the price breakdown, legitimizing the decrease.
MATIC Price Prediction: Is the Bounce Coming to an End?
The technical analysis from the short-term daily time frame also gives a bearish MATIC price prediction, aligning with the readings from the weekly one. The main reason for this is the wave count.
Technical analysts employ the Elliott Wave theory as a means to identify recurring long-term price patterns and investor psychology, which helps them determine the direction of a trend.
The wave count indicates that MATIC began a five-wave downward movement (white) on March 18. If so, it is currently nearing the top of wave four.
If the count is correct the MATIC price will decrease to the $0.72 horizontal support level, which coincides with the long-term support level from the weekly time frame. An elongated wave five could take the price to the 0.786 Fib retracement support level (black).
Fibonacci retracement levels operate on the principle that after a significant price change in one direction, the price will retrace or revisit a previous price level before resuming in its original direction.
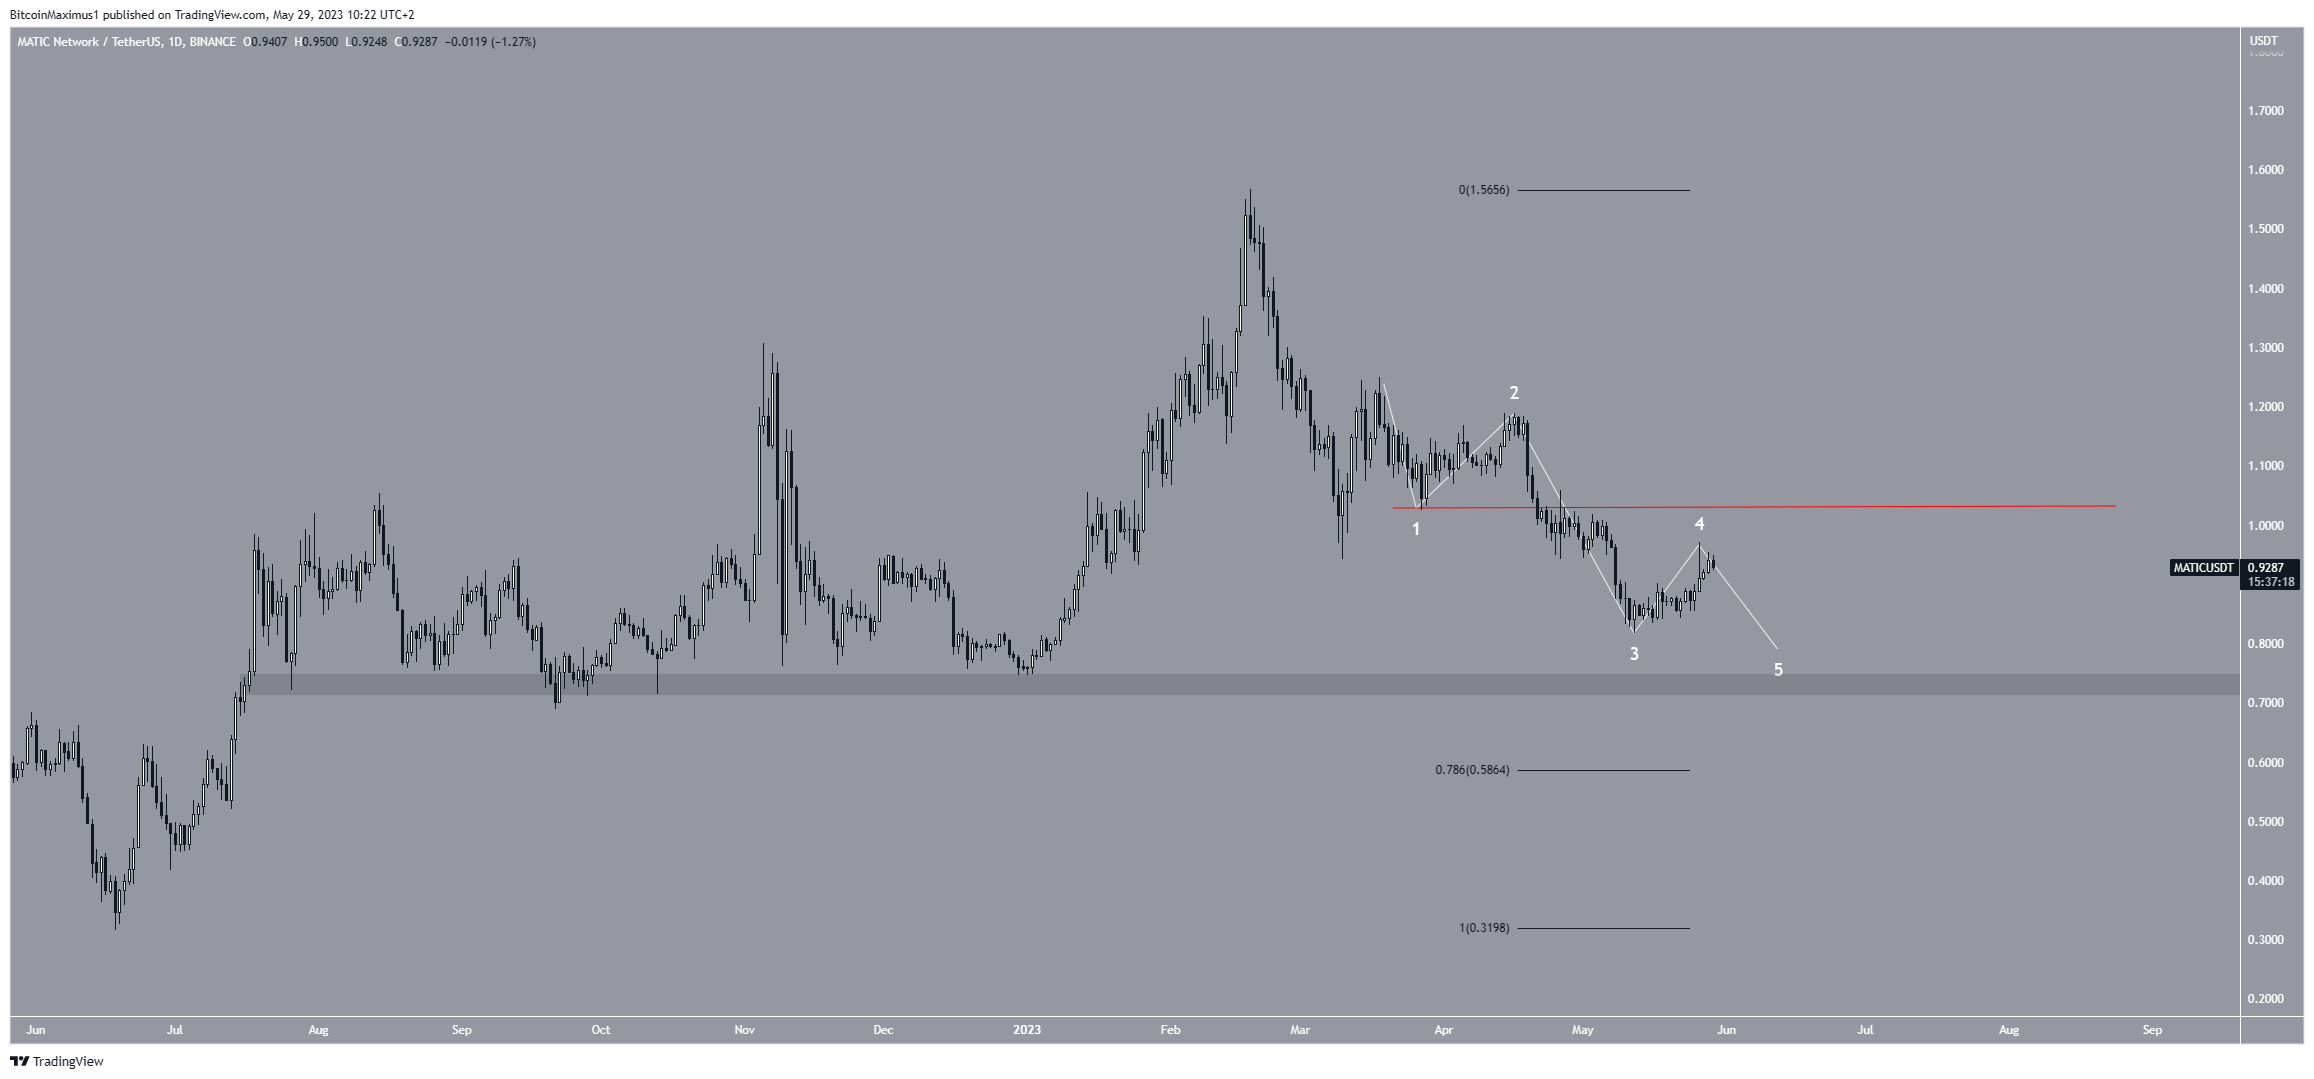
Despite the bearish MATIC price prediction, an increase above the bottom of wave one (red line) at $1.03 will mean that the trend is bullish instead.
This would also take the price above the support line of the long-term channel. In that case, an increase to $1.30 will be likely.
For BeInCrypto’s latest crypto market analysis, click here.
The post Will Polygon (MATIC) Price Rebound or Continue to Decline? appeared first on BeInCrypto.


