


The Shiba Inu (SHIB) price has finally reached the support line of a long-term pattern. Whether it bounces there or breaks down can determine the future trend. If the price breaks down, the entire structure in place for nearly a year will be invalid. In that case, a new bearish trend will have begun. However, […]
The Shiba Inu (SHIB) price has finally reached the support line of a long-term pattern. Whether it bounces there or breaks down can determine the future trend.
If the price breaks down, the entire structure in place for nearly a year will be invalid. In that case, a new bearish trend will have begun. However, if the price bounces, it will increase to the triangle’s resistance line.
Shiba Inu Price Bounces at Support of Long-Term Pattern
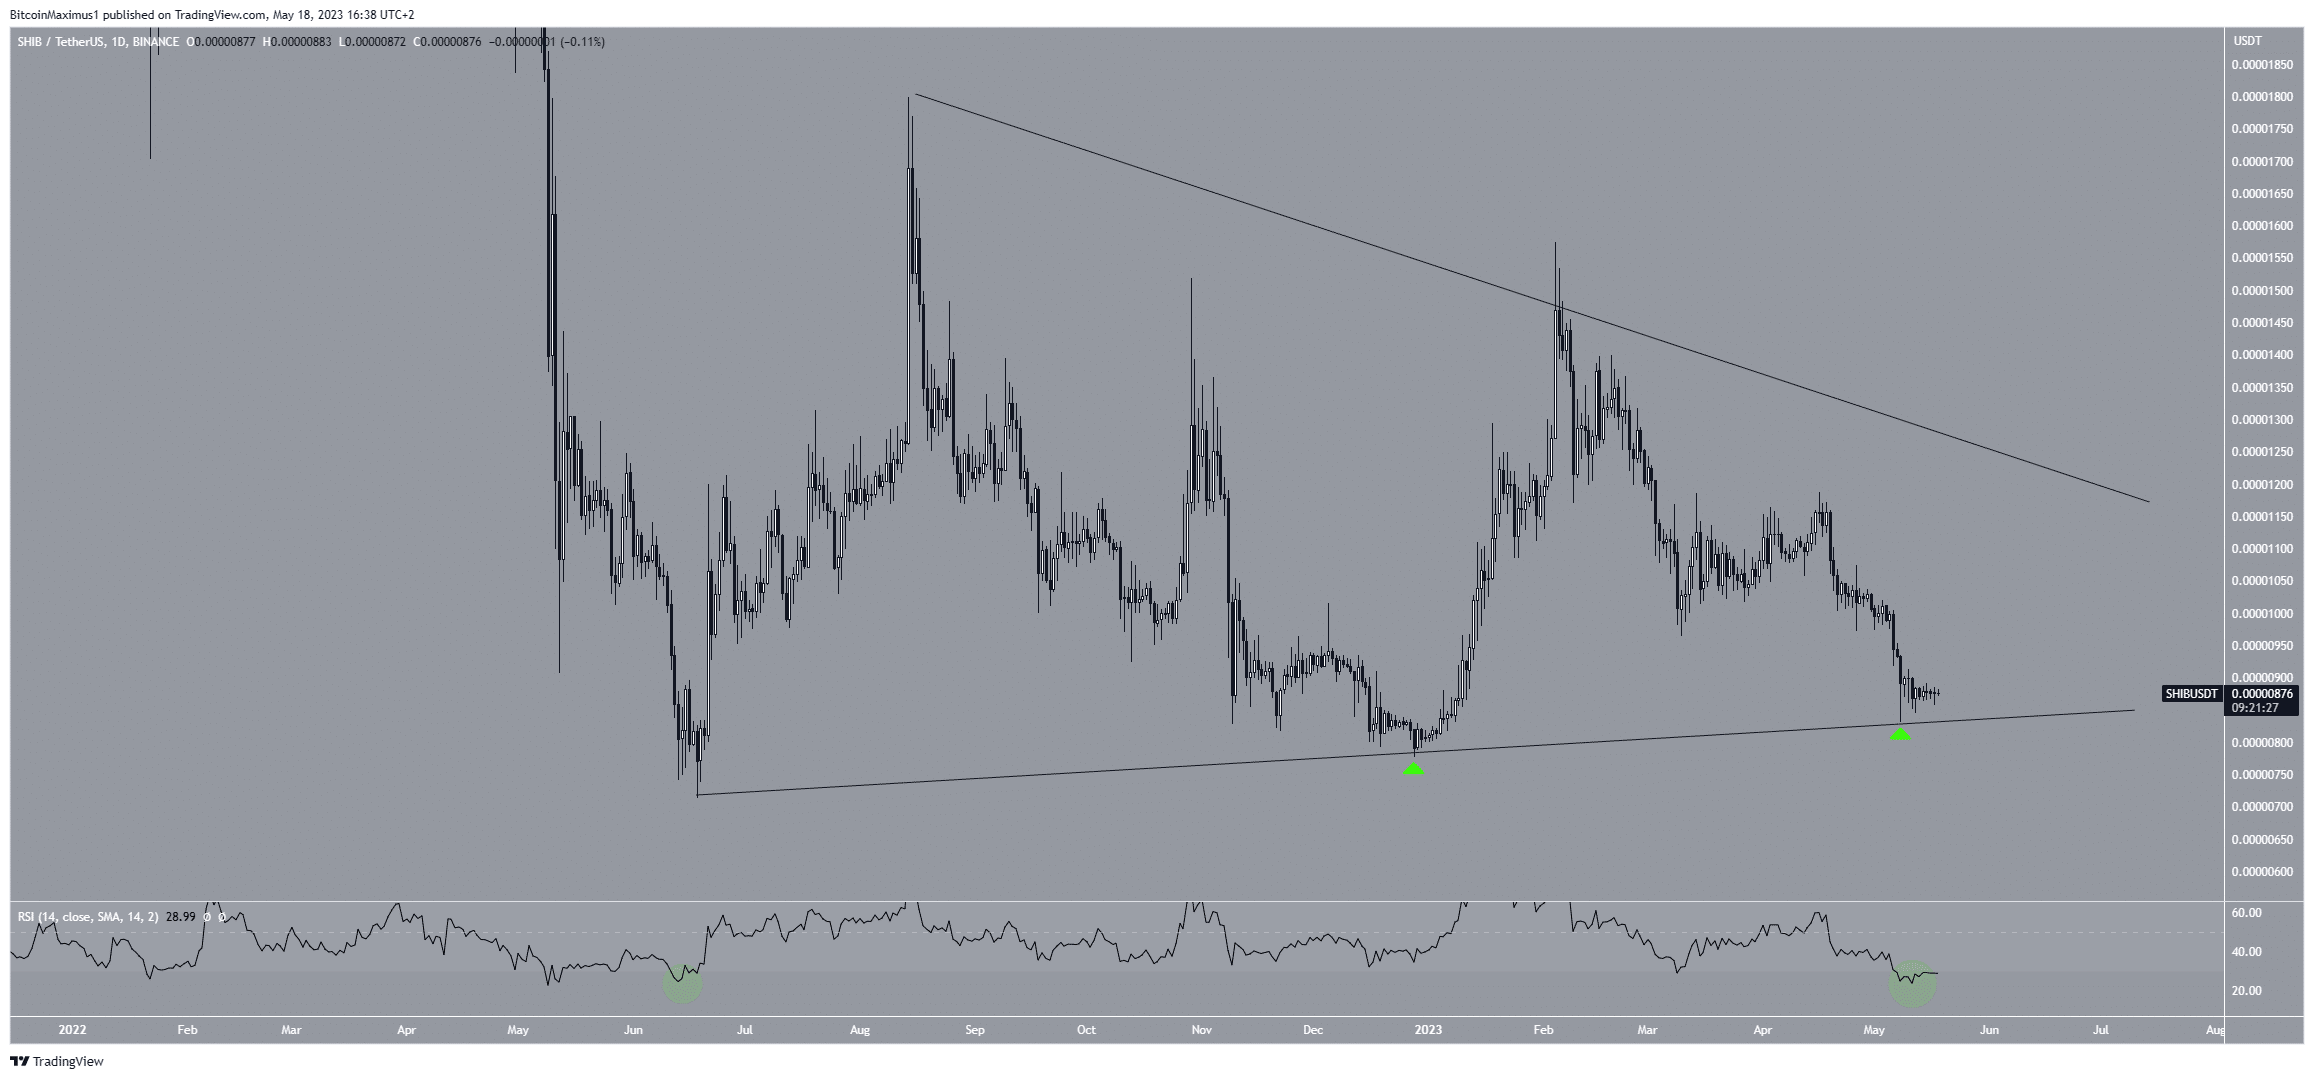
According to the daily analysis, the price of the Shiba Inu coin has been trading within a symmetrical triangle since June 2022. This particular pattern is considered neutral, indicating an equal probability of either an upward breakout or a downward breakdown.
On May 8, the SHIB price bounced at the triangle’s support line, which hadn’t been touched since the beginning of the year (green icons). However, the price has yet to initiate a significant increase.
The daily Relative Strength Index (RSI) provides conflicting signals. Traders utilize the RSI to assess momentum, determine if a market is overbought or oversold, and make decisions regarding buying or selling an asset.
If the RSI reading is above 50 and the trend is upward, it suggests an advantage for the bulls. Conversely, if the reading is below 50, the opposite holds true.
Currently, the RSI is below 50 and declining. However, it has also entered oversold territory. The last time it reached this level, there was a significant upward movement (green circle).
SHIB Price Prediction: Will A Bounce Ensue?
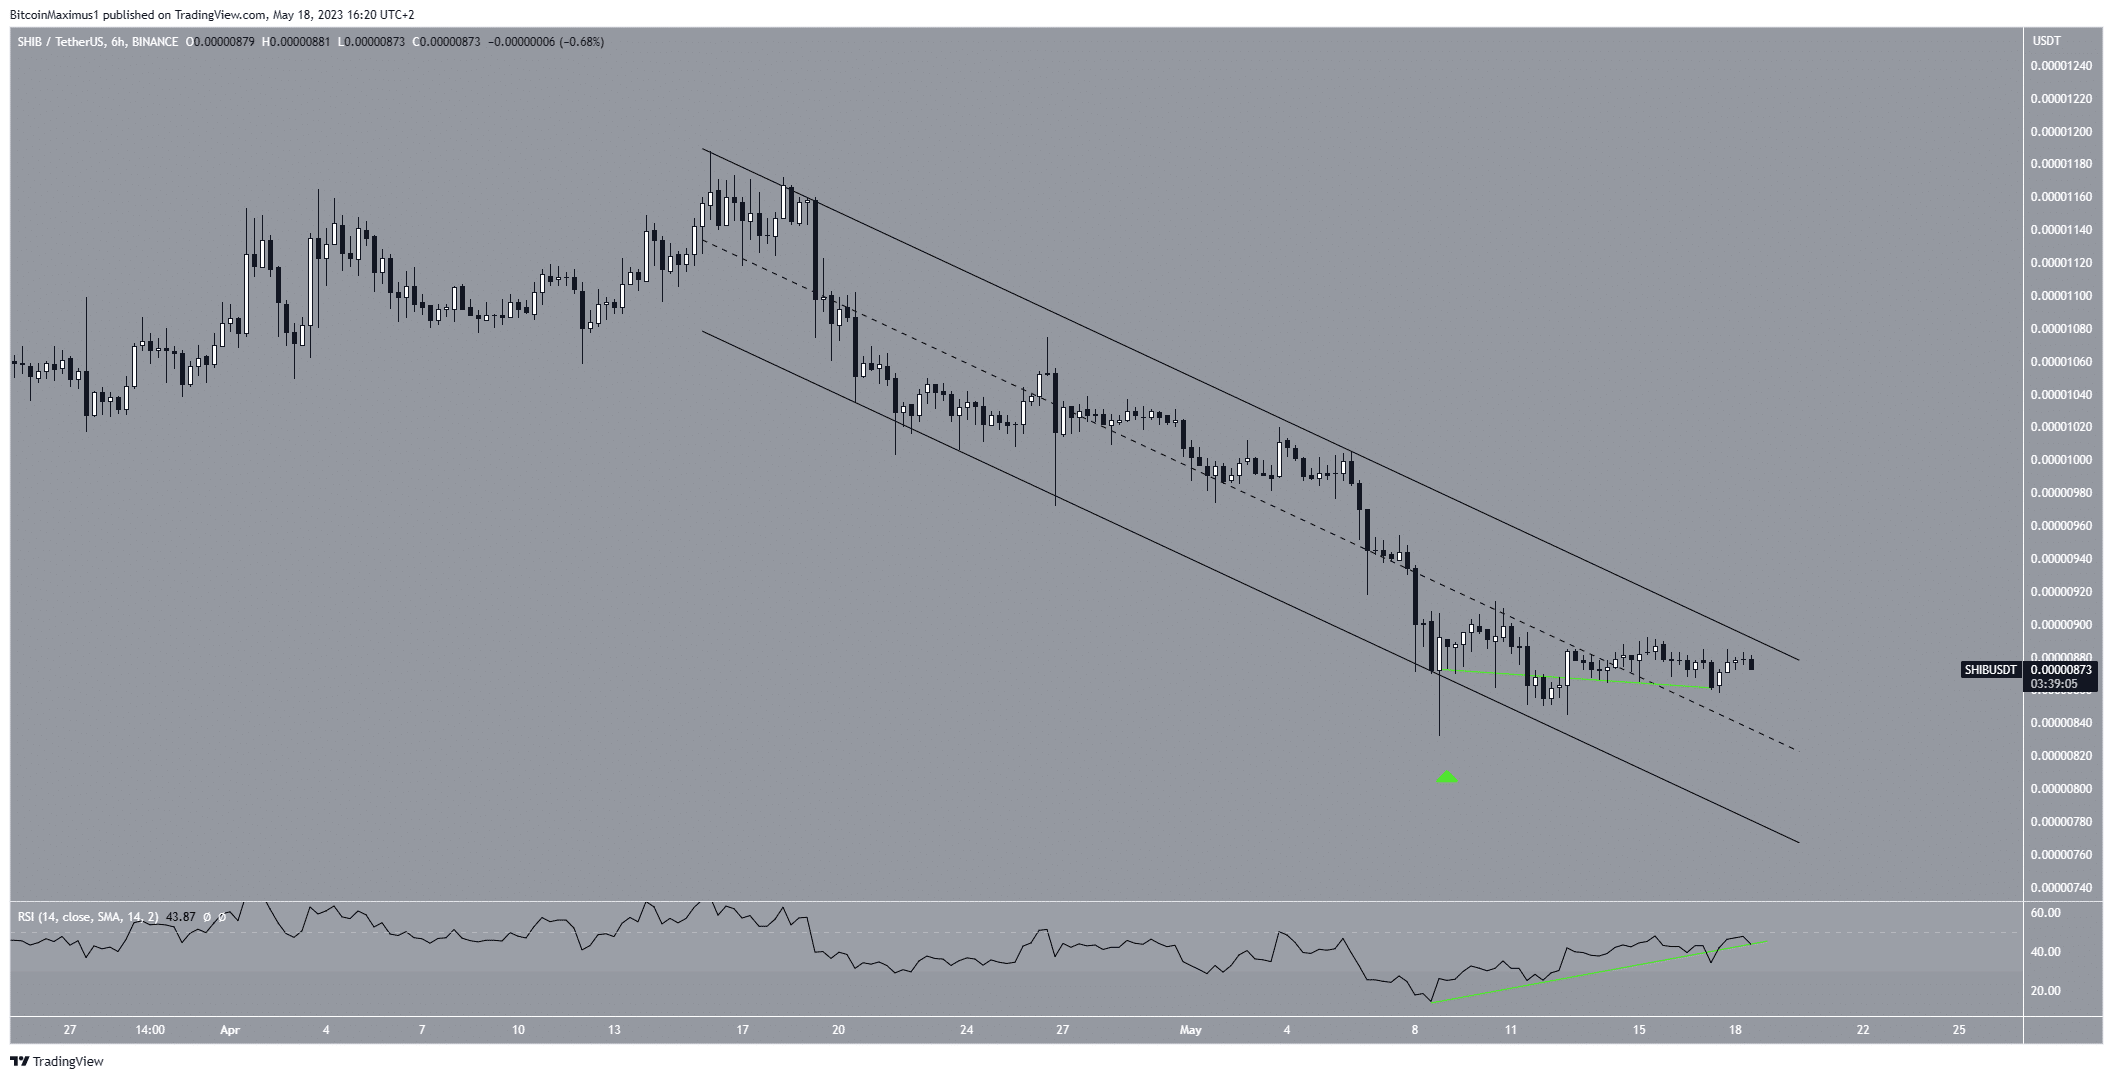
The technical analysis of the short-term six-hour time frame indicates that the price of the meme coin has been decreasing within a descending parallel channel since April 16. These channels are typically seen as bullish patterns as they often result in price breakouts.
On May 8, the price of Shiba rebounded at the support line of this pattern, causing a long lower wick (represented by a green icon). Even though the price has not broken out, it is now trading in the channel’s upper portion. This is a sign that often leads to breakouts.
Similar to the daily timeframe, the six-hour Relative Strength Index (RSI) is showing extreme oversold conditions, suggesting a potential upward movement in the near future. Additionally, the indicator has generated a significant amount of bullish divergence (green line).
This is a type of occurrence in which a price decrease is not supported by a momentum decrease. It often leads to sharp upward movements.
A breakout from the descending channel is likely to trigger an upward price movement toward the resistance line of the long-term triangle, with an average price target of $0.0000130.
Nevertheless, if the price breaks below the support line of the triangle pattern, it could lead to a significant drop toward the next nearest support area at $0.0000057.
This level has not been reached since June 2021.
For BeInCrypto’s latest crypto market analysis, click here
The post Will Shiba Inu (SHIB) Bounce and Save 350-Day Pattern? appeared first on BeInCrypto.


