


The Decentraland (MANA) price has increased by 150% over the past two weeks, breaking out from a 406-day resistance line. The Decentraland price had fallen under a descending resistance line since reaching an all-time high price of $5.90 in Nov. 2021. The downward movement led to a low of $0.28 in Dec. 2022. The MANA […]
The Decentraland (MANA) price has increased by 150% over the past two weeks, breaking out from a 406-day resistance line.
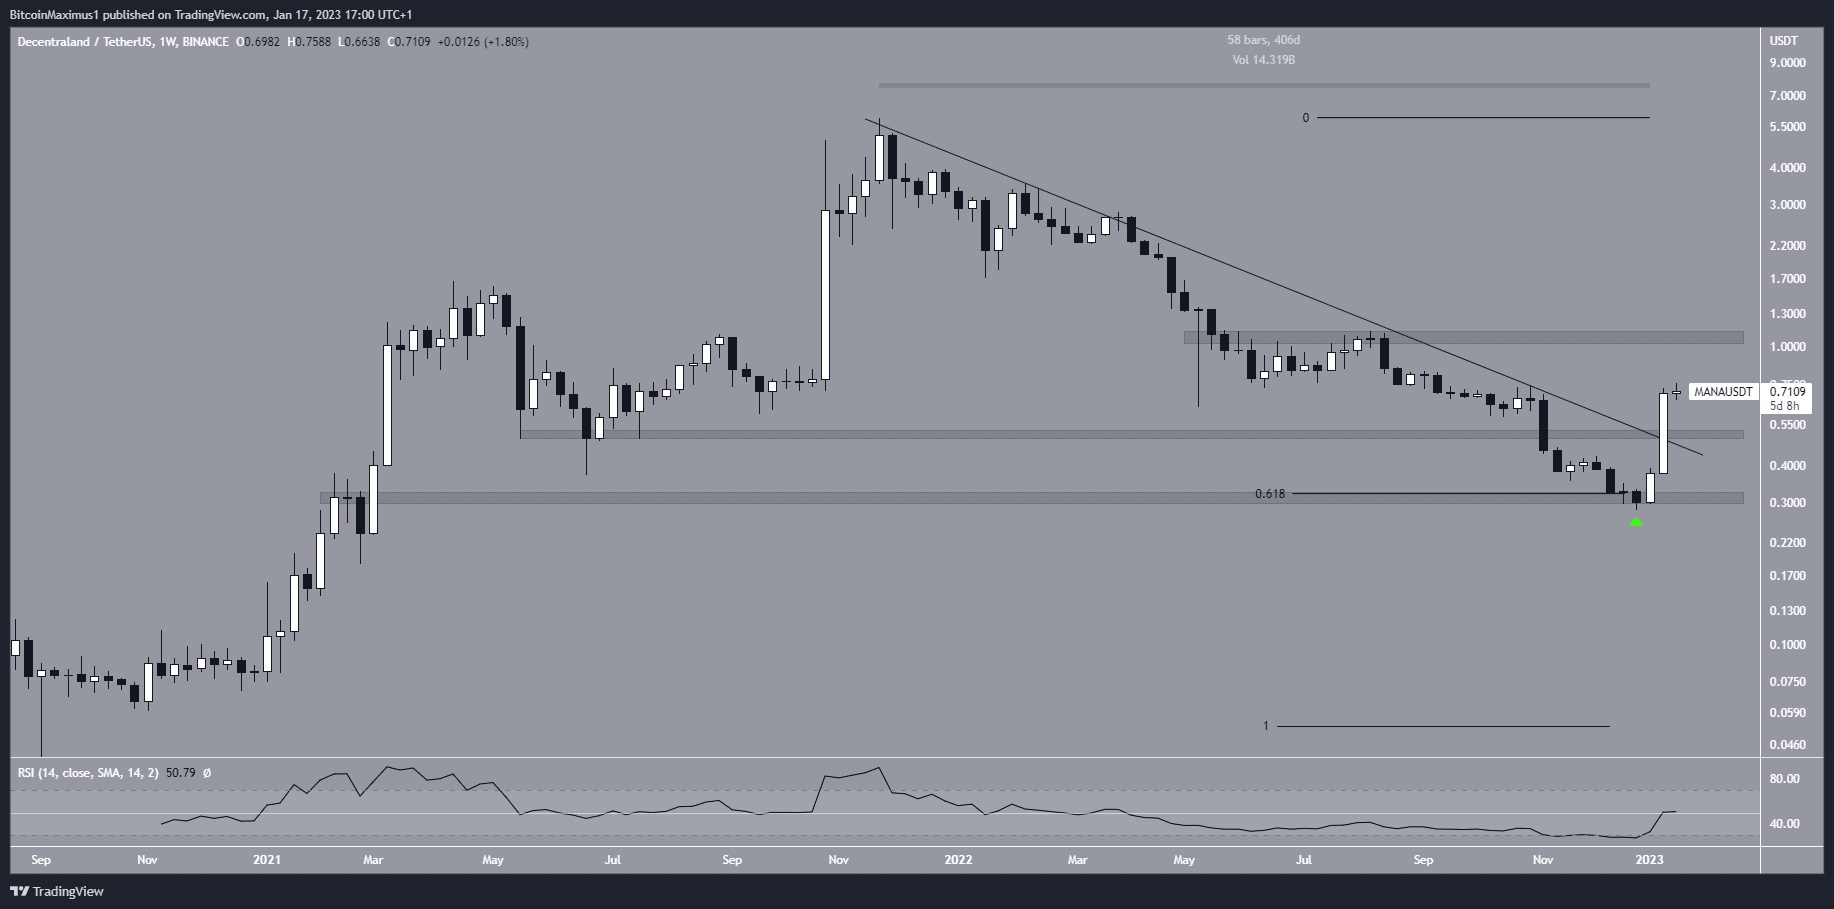
The Decentraland price had fallen under a descending resistance line since reaching an all-time high price of $5.90 in Nov. 2021. The downward movement led to a low of $0.28 in Dec. 2022.
The MANA price bounced afterward, validating the $0.30 horizontal support area in the process. This was a crucial development since the $0.30 area was both a horizontal and Fib support level. As a result, a breakdown below it could have further hastened the rate of decrease.
Since the bounce, the MANA price has increased by 150%. Last week, it broke out from both the long-term descending resistance line and the $0.51 horizontal area, which is now expected to act as support. Furthermore, the weekly RSI is in the process of moving above 50.
If this occurs, the MANA token price could increase toward the next resistance at an average price of $1.10. Conversely, a weekly close below $0.51 would mean that the trend is still bearish.
MANA Struggles to Reclaim Resistance
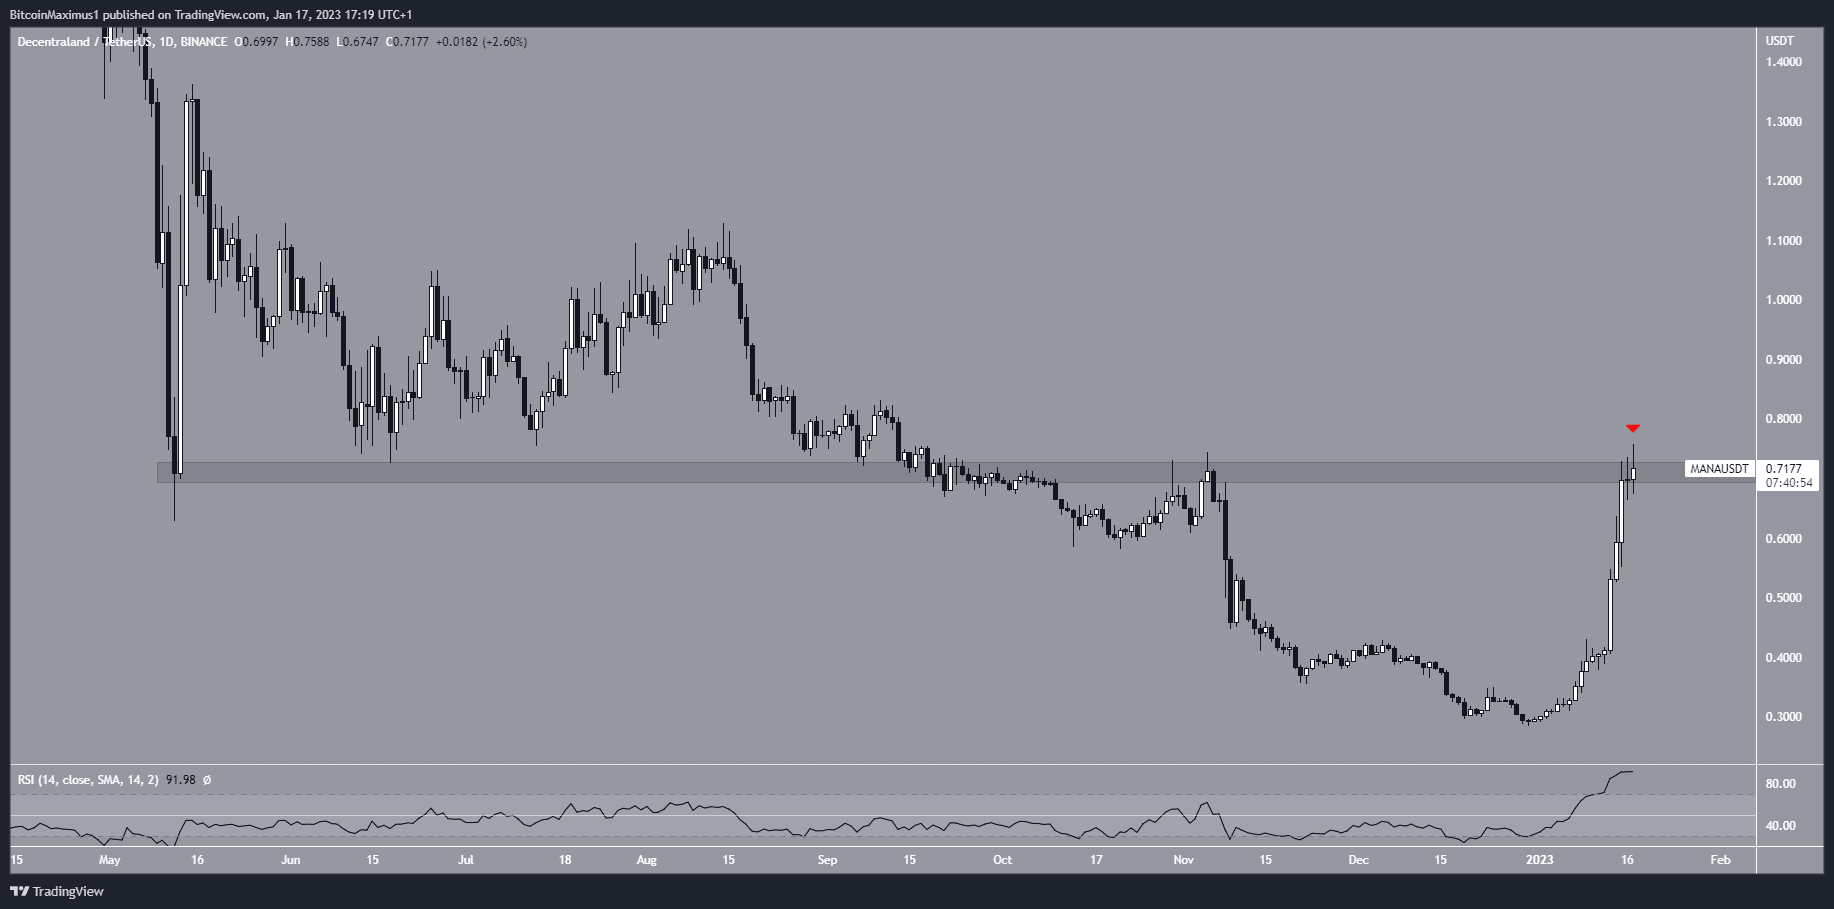
A closer look at the daily time frame movement shows that the Decentraland price is struggling to move above the $0.71 resistance area. While it briefly moved above it, it created a long upper wick (red icon) over the past 24 hours, which is considered a sign of selling pressure.
Furthermore, the daily RSI is extremely oversold, though it has not generated any bearish divergence yet.
If the rejection is confirmed, the most likely MANA price analysis would be a drop in the direction of the aforementioned $0.51 long-term support area.
A reclaim of this area would be required for the Decentraland price prediction for Jan. to be bullish.
Retracement Before Eventual Breakout
The wave count also supports the possibility that the Decentraland price is due for a correction. The digital asset seems to be in the fifth and final wave of an upward movement that began on Jan. 1. If so, wave five has an outsized extension and is 2.61 times the length of waves one and three combined (black).
Additionally, the six-hour RSI has generated bearish divergence (green line). This aligns with the wave count and rejection from the $0.71 area.
If a downturn follows, the closest support levels would be at $0.58 and $0.52. These are created by the 0.382 and 0.5 Fib retracement support levels, respectively.
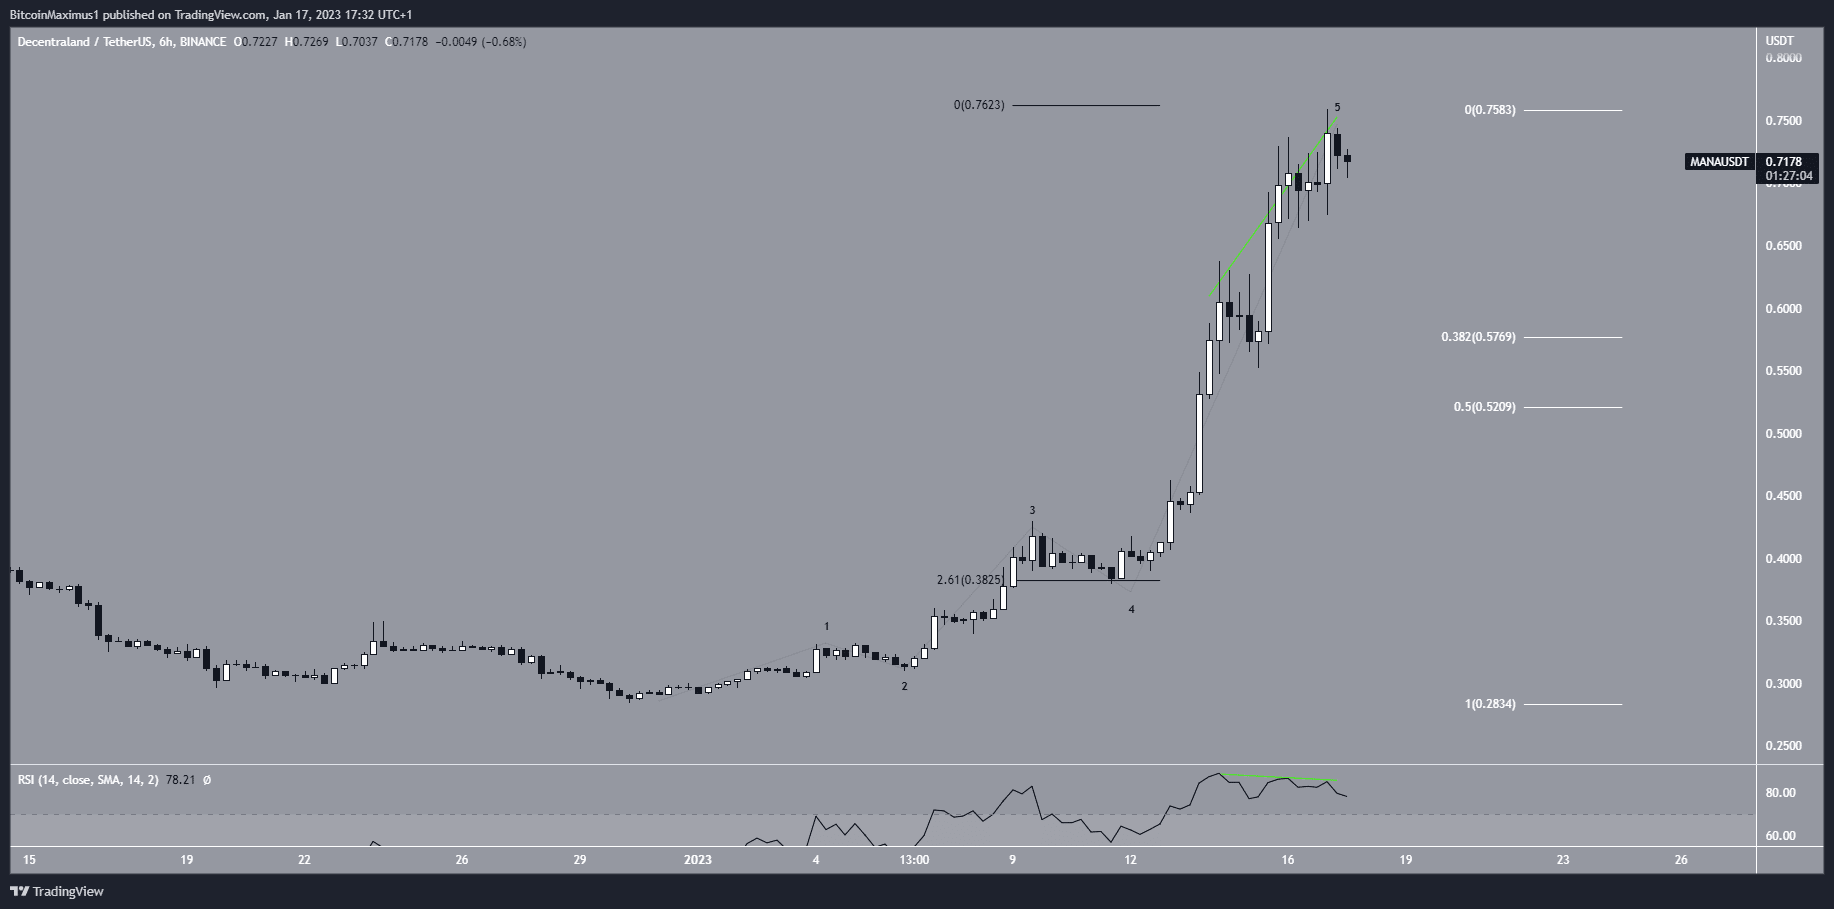
To conclude, the most likely MANA price movement would be a retracement of the increase that began on Jan. 1. The closest support levels are at $0.58 and $0.52. A weekly close above $0.71 would invalidate this bearish short-term MANA forecast.
For BeInCrypto’s latest crypto market analysis, click here.
The post Betting on the Metaverse? Decentraland (MANA) Should Be on Your List appeared first on BeInCrypto.


