


The Dogecoin (DOGE) price is at risk of breaking down from a long-term ascending support line in place for almost a year. If a breakdown transpires, a sharp fall could follow. However, short-term time frame readings suggest that the price will first initiate a bounce. Dogecoin Price Returns to Long-Term Support The technical analysis from […]
The Dogecoin (DOGE) price is at risk of breaking down from a long-term ascending support line in place for almost a year.
If a breakdown transpires, a sharp fall could follow. However, short-term time frame readings suggest that the price will first initiate a bounce.
Dogecoin Price Returns to Long-Term Support
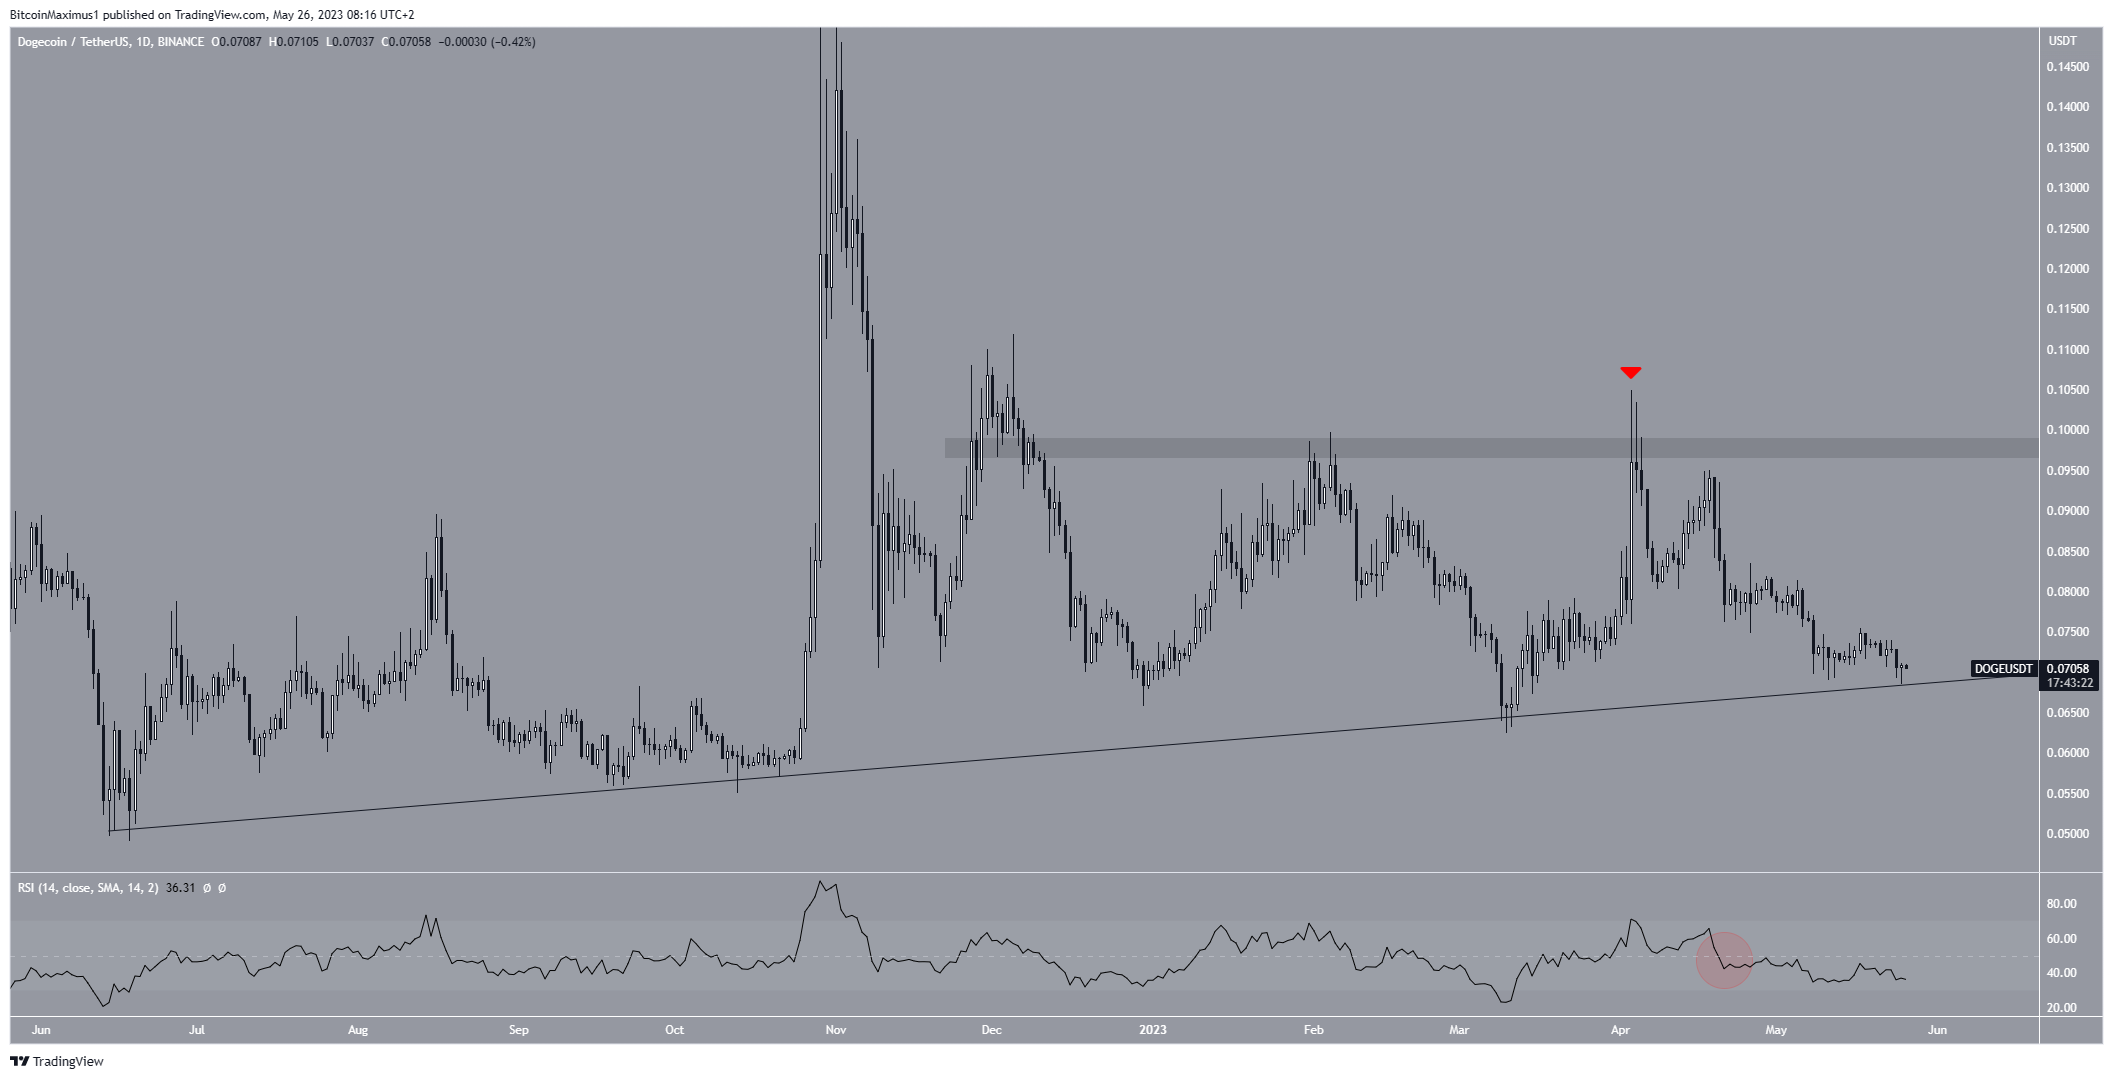
The technical analysis from the daily time frame shows that the DOGE price has returned to an ascending support line that has been in place since June 2022. The line holds tremendous significance since it has been in place for such a long period of time.
The decrease to the support line began on April 4, when the price was rejected by the $0.096 resistance area (red icon), creating a long upper wick. The wick is considered a sign of selling pressure since buyers could not sustain the increase.
The RSI reading is leaning bearish. By using the RSI as a momentum indicator, traders can determine whether a market is overbought or oversold and decide whether to accumulate or sell an asset.
If the RSI reading is above 50 and the trend is upward, bulls have an advantage, but if the reading is below 50, the opposite is true.
Even though the RSI is increasing, it is still below 50, as it has been since it broke down on April 17 (red circle).
DOGE Price Prediction: Will a Bounce Ensue?
The readings from the six-hour time frame give a bullish DOGE price prediction, at least for the short term. The main reason for this is the wave count.
The wave count shows a completed five-wave downward movement (white), which took a wedge shape. Hence, it is likely a leading diagonal.
After such five-wave movements, it is customary for the price to retrace a large portion of the previous decrease. So, if a retracement, follows, the most likely area to provide resistance will be at $0.091, the 0.618 Fib retracement resistance level.
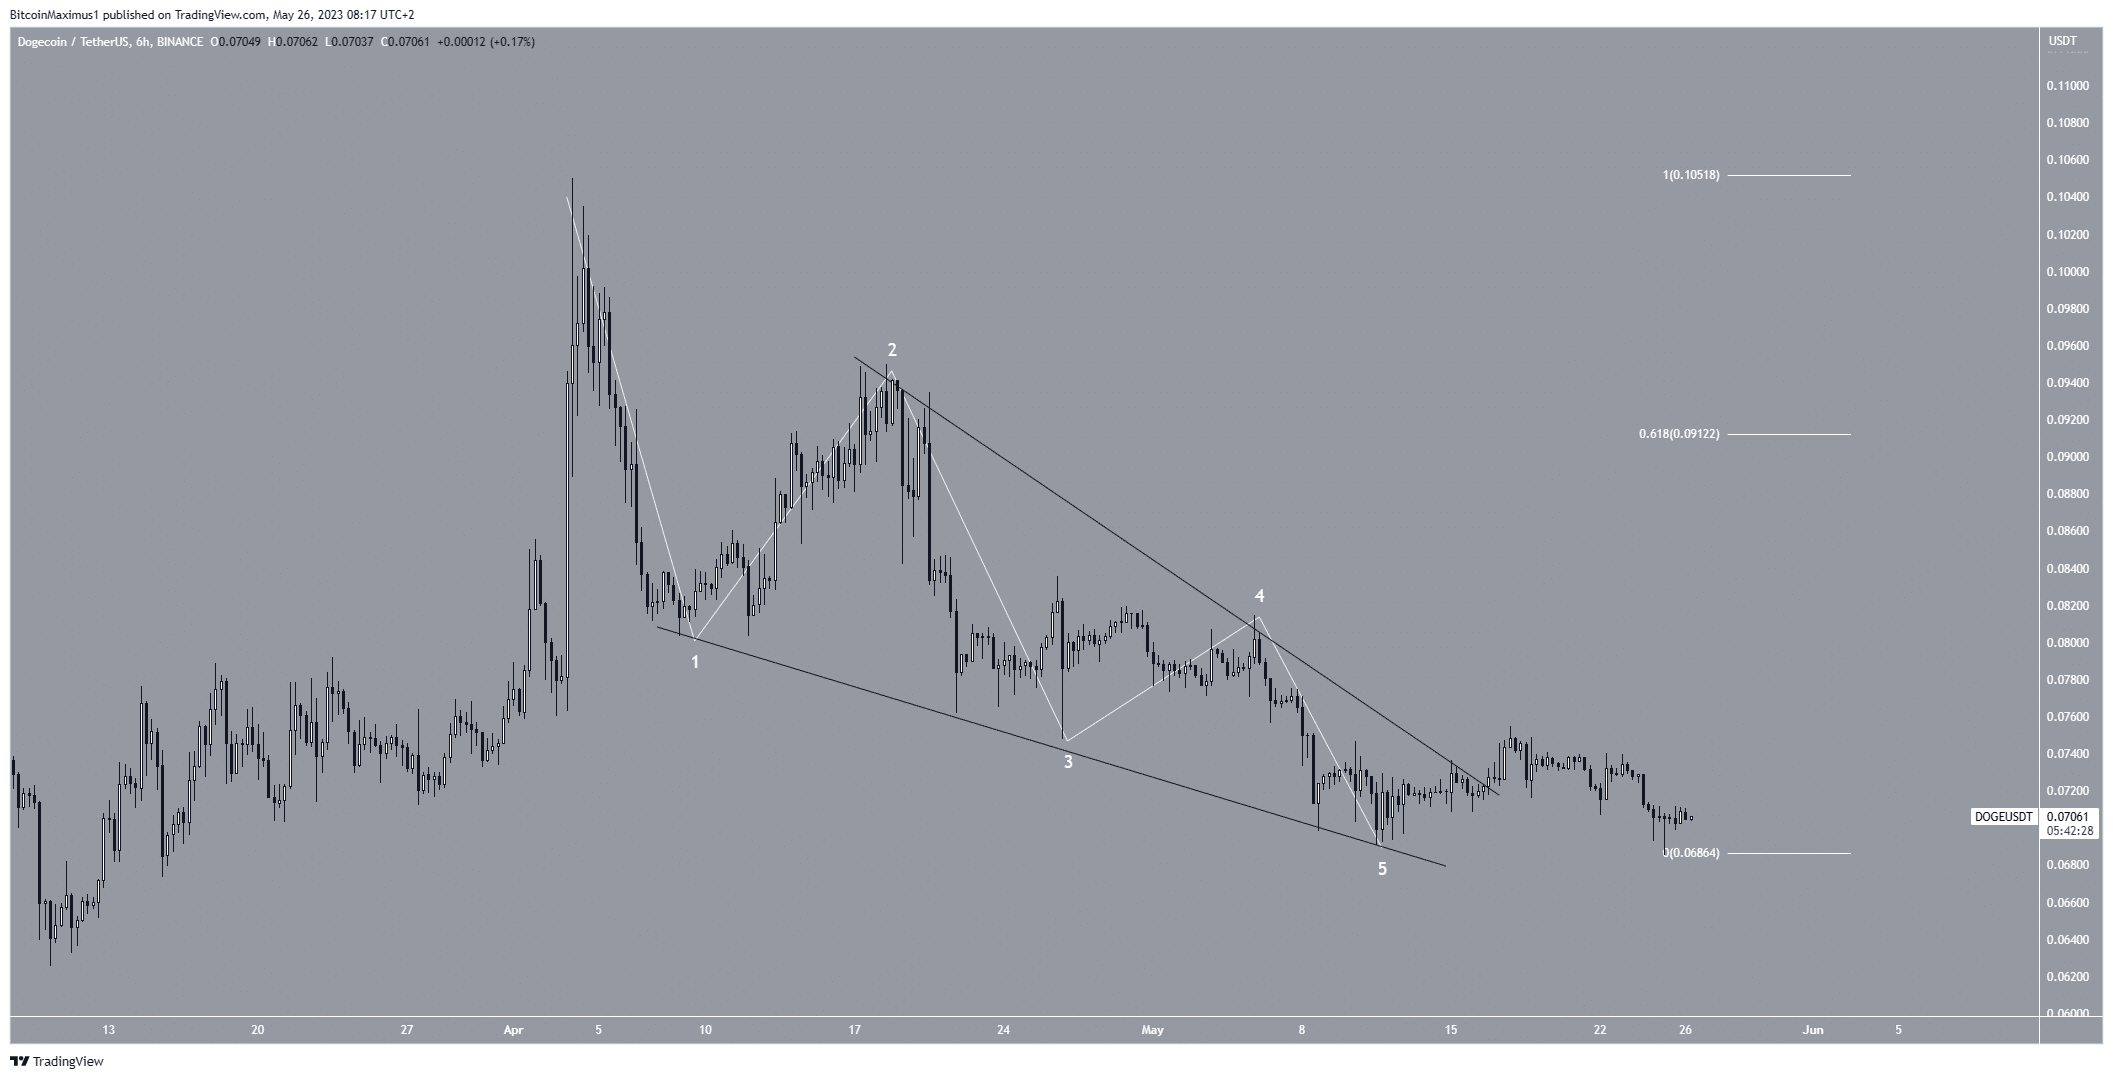
Despite this bullish short-term prediction, a fall below $0.069 will mean that the price is still correcting, even in the short term.
In that case, a breakdown from the long-term ascending support line and a fall to $0.057 will be the most likely scenario.
For BeInCrypto’s latest crypto market analysis, click here.
The post Dogecoin (DOGE) Price at 300-Day Support: Sink or Swim? appeared first on BeInCrypto.


