

Ethereum’s (ETH) price has reached a long-term ascending support line that has been in place for nearly 460 days. While the price action shows conflicting readings, the RSI has generated a bullish signal that could lead to a significant price increase. Ethereum Price Reaches 460-Day Ascending Support Line The daily time frame technical analysis for […]
Ethereum’s (ETH) price has reached a long-term ascending support line that has been in place for nearly 460 days.
While the price action shows conflicting readings, the RSI has generated a bullish signal that could lead to a significant price increase.
Ethereum Price Reaches 460-Day Ascending Support Line
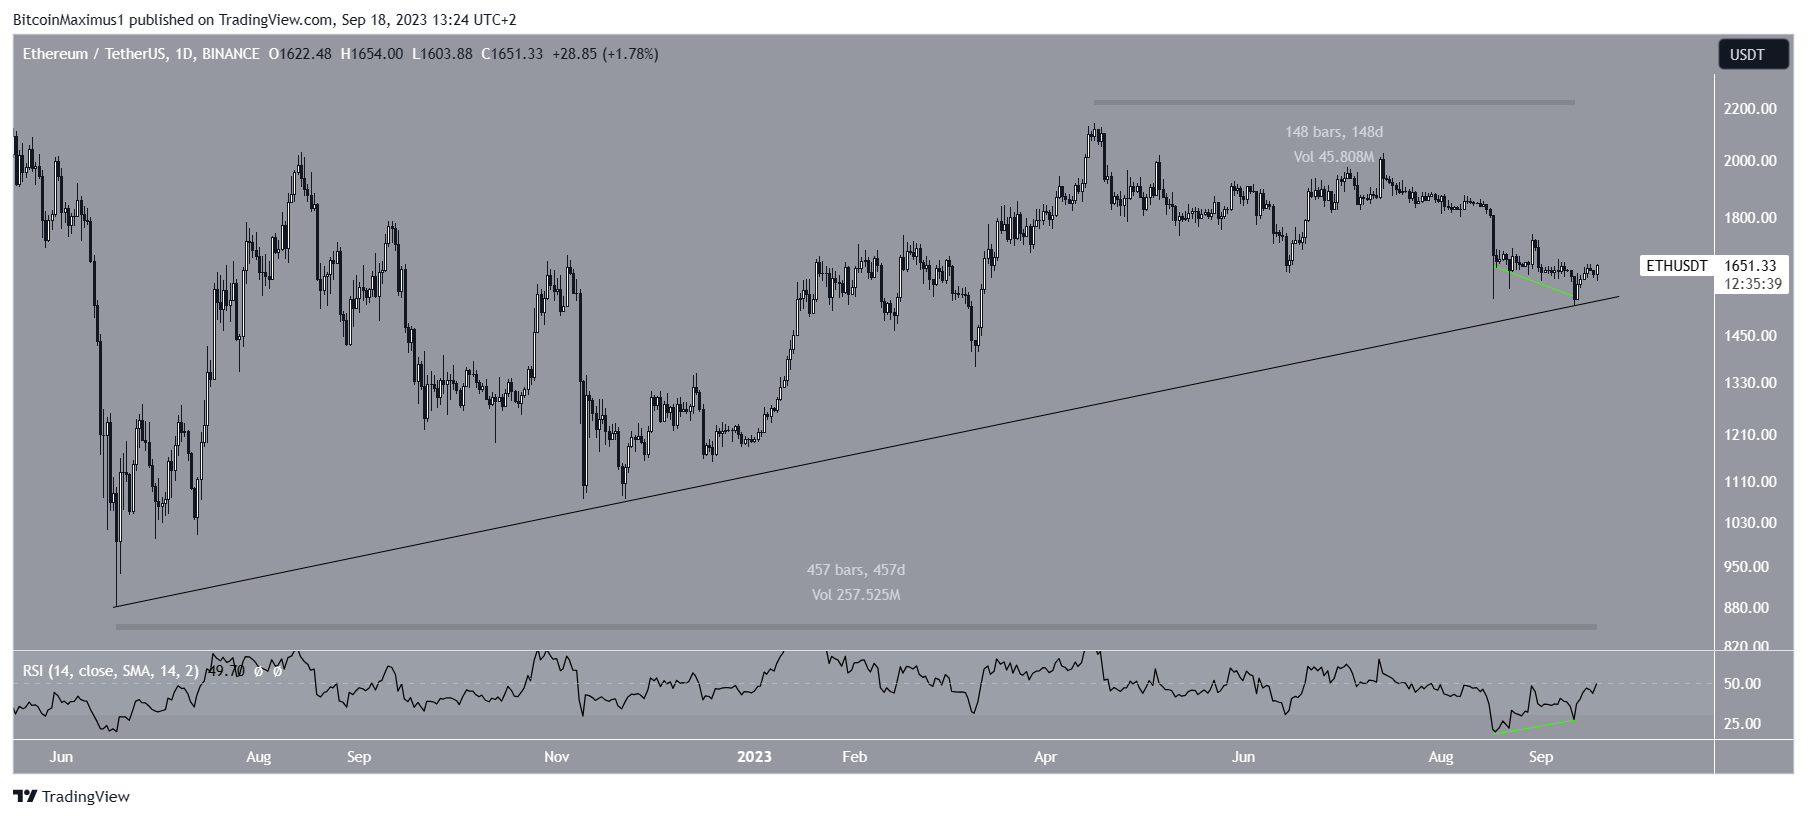
The daily time frame technical analysis for Ethereum provides mixed readings. The ETH price has fallen since its yearly high of $2,140 on April 16, creating a lower high on July 14 (red icon).
The downward movement has been ongoing for 148 days, culminating in a low of $1,531 on September 11. The price has increased since.
The ETH bounce is especially important since it validated an ascending support line that has been in place since the upward movement began in June 2022.
Since the line has stood for such a long period of time, it was expected to provide a strong reaction once the price got there. ETH did reach a high of $1,654 four days later but has fallen slightly since.
The daily RSI is bullish, supporting the continuing increase. When evaluating market conditions, traders use the RSI as a momentum indicator to determine if a market is overbought or oversold and to decide whether to accumulate or sell an asset.
If the RSI reading is above 50 and the trend is upward, bulls still have an advantage, but if the reading is below 50, the opposite is true. Even though the RSI is still below 50, it is increasing in a strong upward trend.
Moreover, it has generated a significant amount of bullish divergence. This occurs when a price decrease is combined with a momentum increase. It often leads to significant upward movements. While this aligns with the bounce at the long-term support line, such an increase has yet to occur.
Check out the 9 Best AI Crypto Trading Bots to Maximize Your Profits.
ETH Price Prediction: Sink-or-Swim at Critical Support?
The shorter-term six-hour timeframe shows that the ETH price is trading at a confluence of critical levels. On the one hand, the price is trading inside the $1,615 horizontal support area. The area has been in place since Aug. 17, except for a deviation on September 11 (green circle). The deviation and reclaim is a bullish sign, which would be expected to lead to a large increase if the ETH price holds above the area.
However, Ethereum still trades below a descending resistance line that has been in place since July 15. The trend cannot be considered bullish until the price breaks out.
Since the convergence between the line and the support area is nearing, a decisive movement is expected soon.
In the news, Ethereum’s Holesky testnet launch has been postponed for a week because of a parameter mismatch. After the testnet, the Dencun upgrade will adjust a mechanism to slow down the ETH staking rate.
The upgrade is expected to launch in late October. Finally, the FTX exchange plans to liquidate $192 million in ETH tokens.
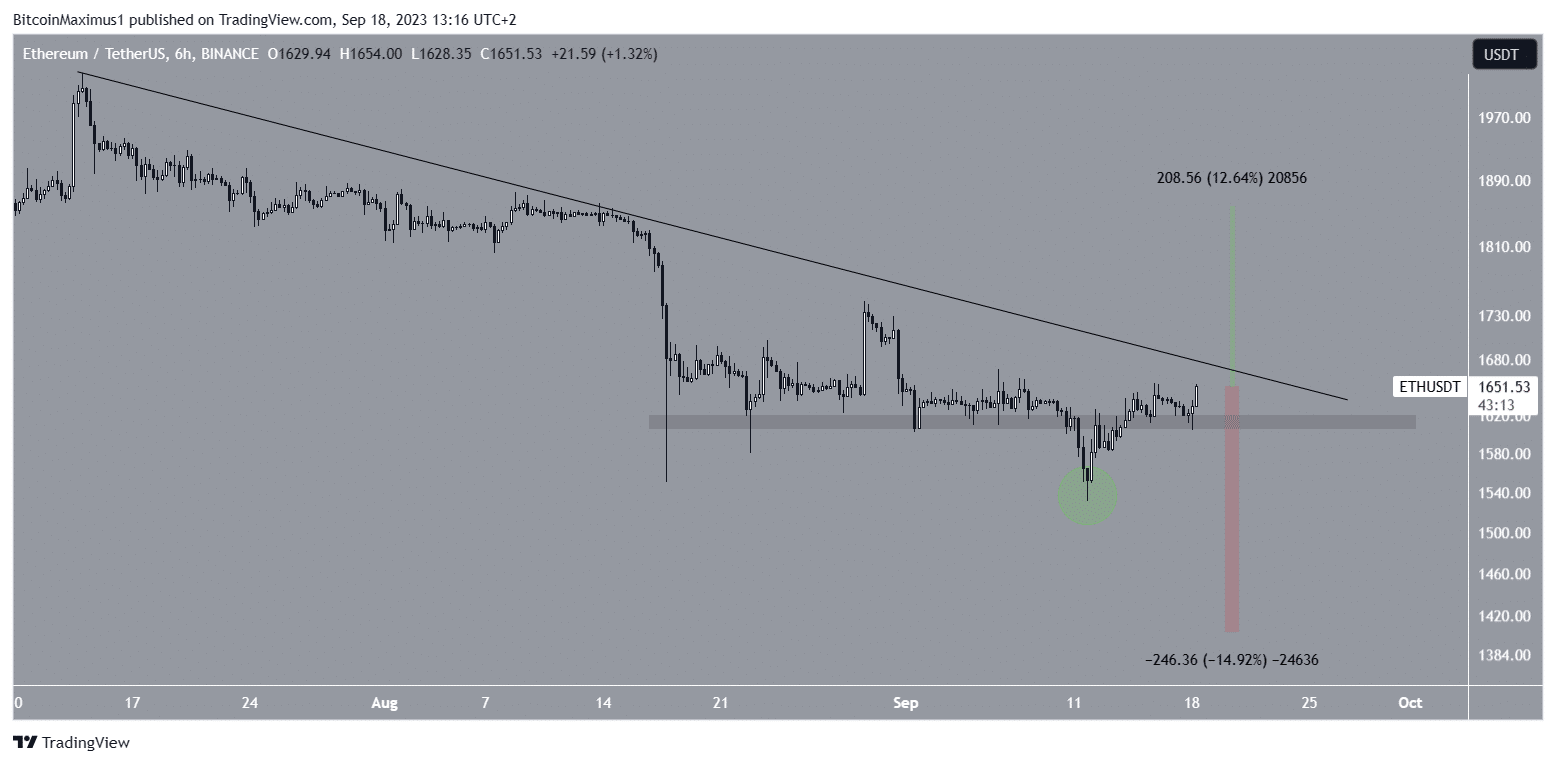
As a result, the ETH price prediction will be determined by whether the price breaks out from the resistance line or breaks down from the $1,615 horizontal support area. In case of a breakout, a 12% increase to the next resistance at $1,900 will likely occur.
However, a breakdown from the $1,615 horizontal area will also cause a breakdown from the long-term ascending support line. In that case, a 15% drop to the $1,400 support area will be expected.
Looking to be profitable? Learn How To Make Money in a Bear Market.
For BeInCrypto’s latest crypto market analysis, click here.
The post Ethereum (ETH) Price Moves Above $1,650 Despite Holesky Testnet Delay appeared first on BeInCrypto.

