


The Stellar (XLM) price has fallen since the beginning of April. It lost a crucial horizontal area during the downward movement. However, while the long-term readings are bearish, the short-term chart suggests that a bounce could transpire soon. Stellar Price Might Have Completed Correction The technical analysis from the daily time frame shows that the […]
The Stellar (XLM) price has fallen since the beginning of April. It lost a crucial horizontal area during the downward movement.
However, while the long-term readings are bearish, the short-term chart suggests that a bounce could transpire soon.
Stellar Price Might Have Completed Correction
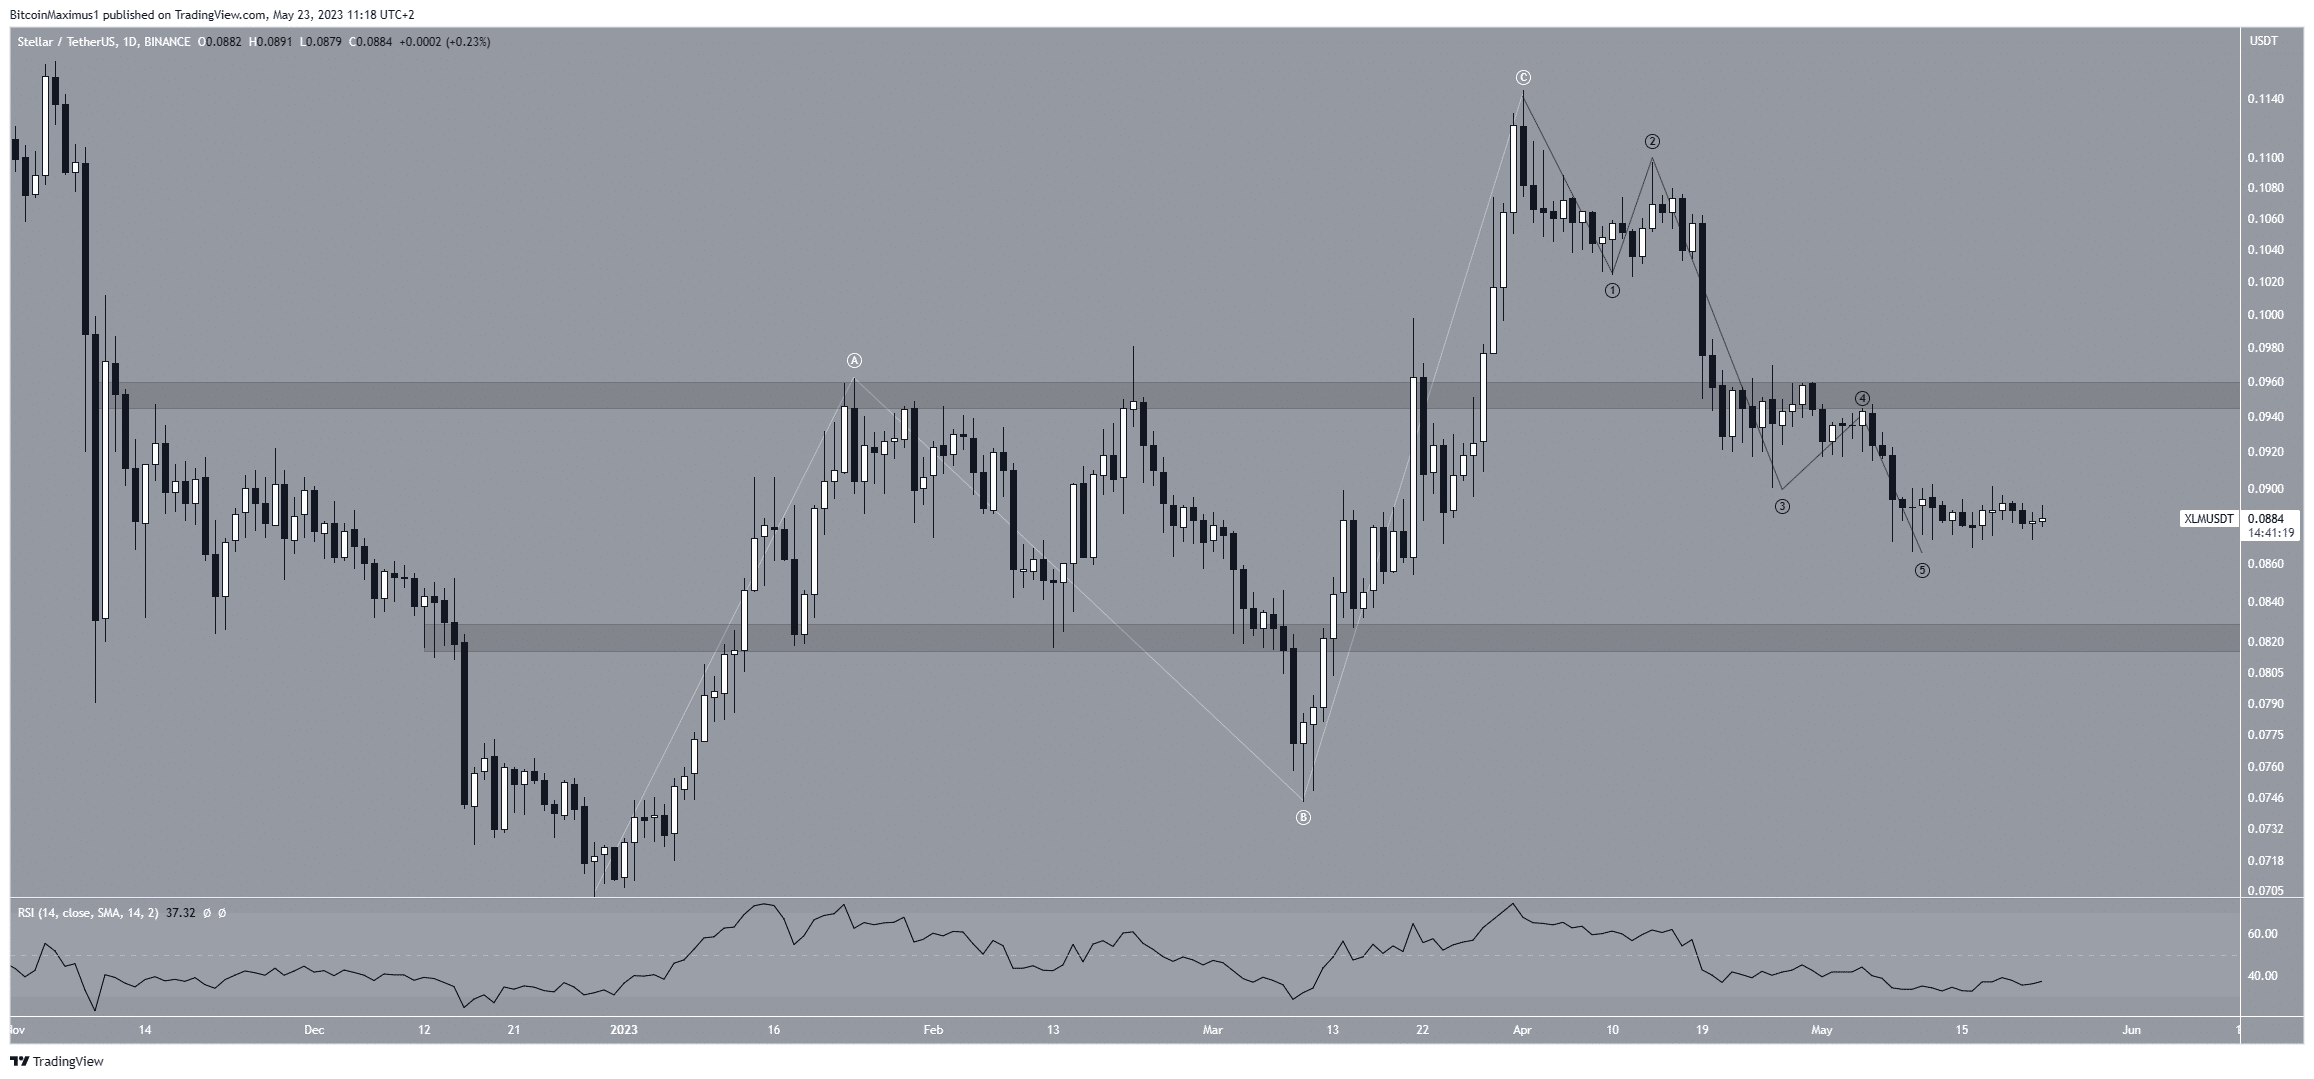
The technical analysis from the daily time frame shows that the XLM price has fallen since reaching a yearly high of $0.11 on April 1.
During the fall, XLM fell below the $0.095 area, which was expected to provide support. The area will likely provide resistance in the future.
The decrease since the high resembles a five-wave downward movement (black). If so, XLM is currently in the fifth and final wave of the decrease. Since the preceding increase was an A-B-C corrective structure (white), the wave count suggests that the trend is bearish.
To determine the direction of a trend, technical analysts use the Elliott Wave theory, which involves studying recurring long-term price patterns and investor psychology.
The Relative Strength Index (RSI) reading is leaning bearish. When evaluating market conditions, traders use the RSI as a momentum indicator to determine if a market is overbought or oversold and to decide whether to accumulate or sell an asset.
If the RSI reading is above 50 and the trend is upward, bulls still have an advantage, but if the reading is below 50, the opposite is true. Even though the RSI is increasing, it is still below 50, a sign of a bearish trend.
XLM Price Prediction: Will Bounce Transpire?
The technical analysis from the short-term six-hour time frame suggests that a bounce is forthcoming. The main reason for this is the RSI reading.
Since May 9, the RSI has generated a significant amount of bullish divergence (green line). When evaluating market conditions, traders use the RSI as a momentum indicator to determine if a market is overbought or oversold and to decide whether to accumulate or sell an asset.
If the RSI reading is above 50 and the trend is upward, bulls still have an advantage, but if the reading is below 50, the opposite is true. A bullish divergence occurs when a decrease in momentum does not accompany a price decrease.
This often leads to sharp bullish trend reversals.
If an upward movement transpires, the XLM price can increase toward the $0.105 resistance region, which is created by the 0.5-0.618 Fib retracement resistance.
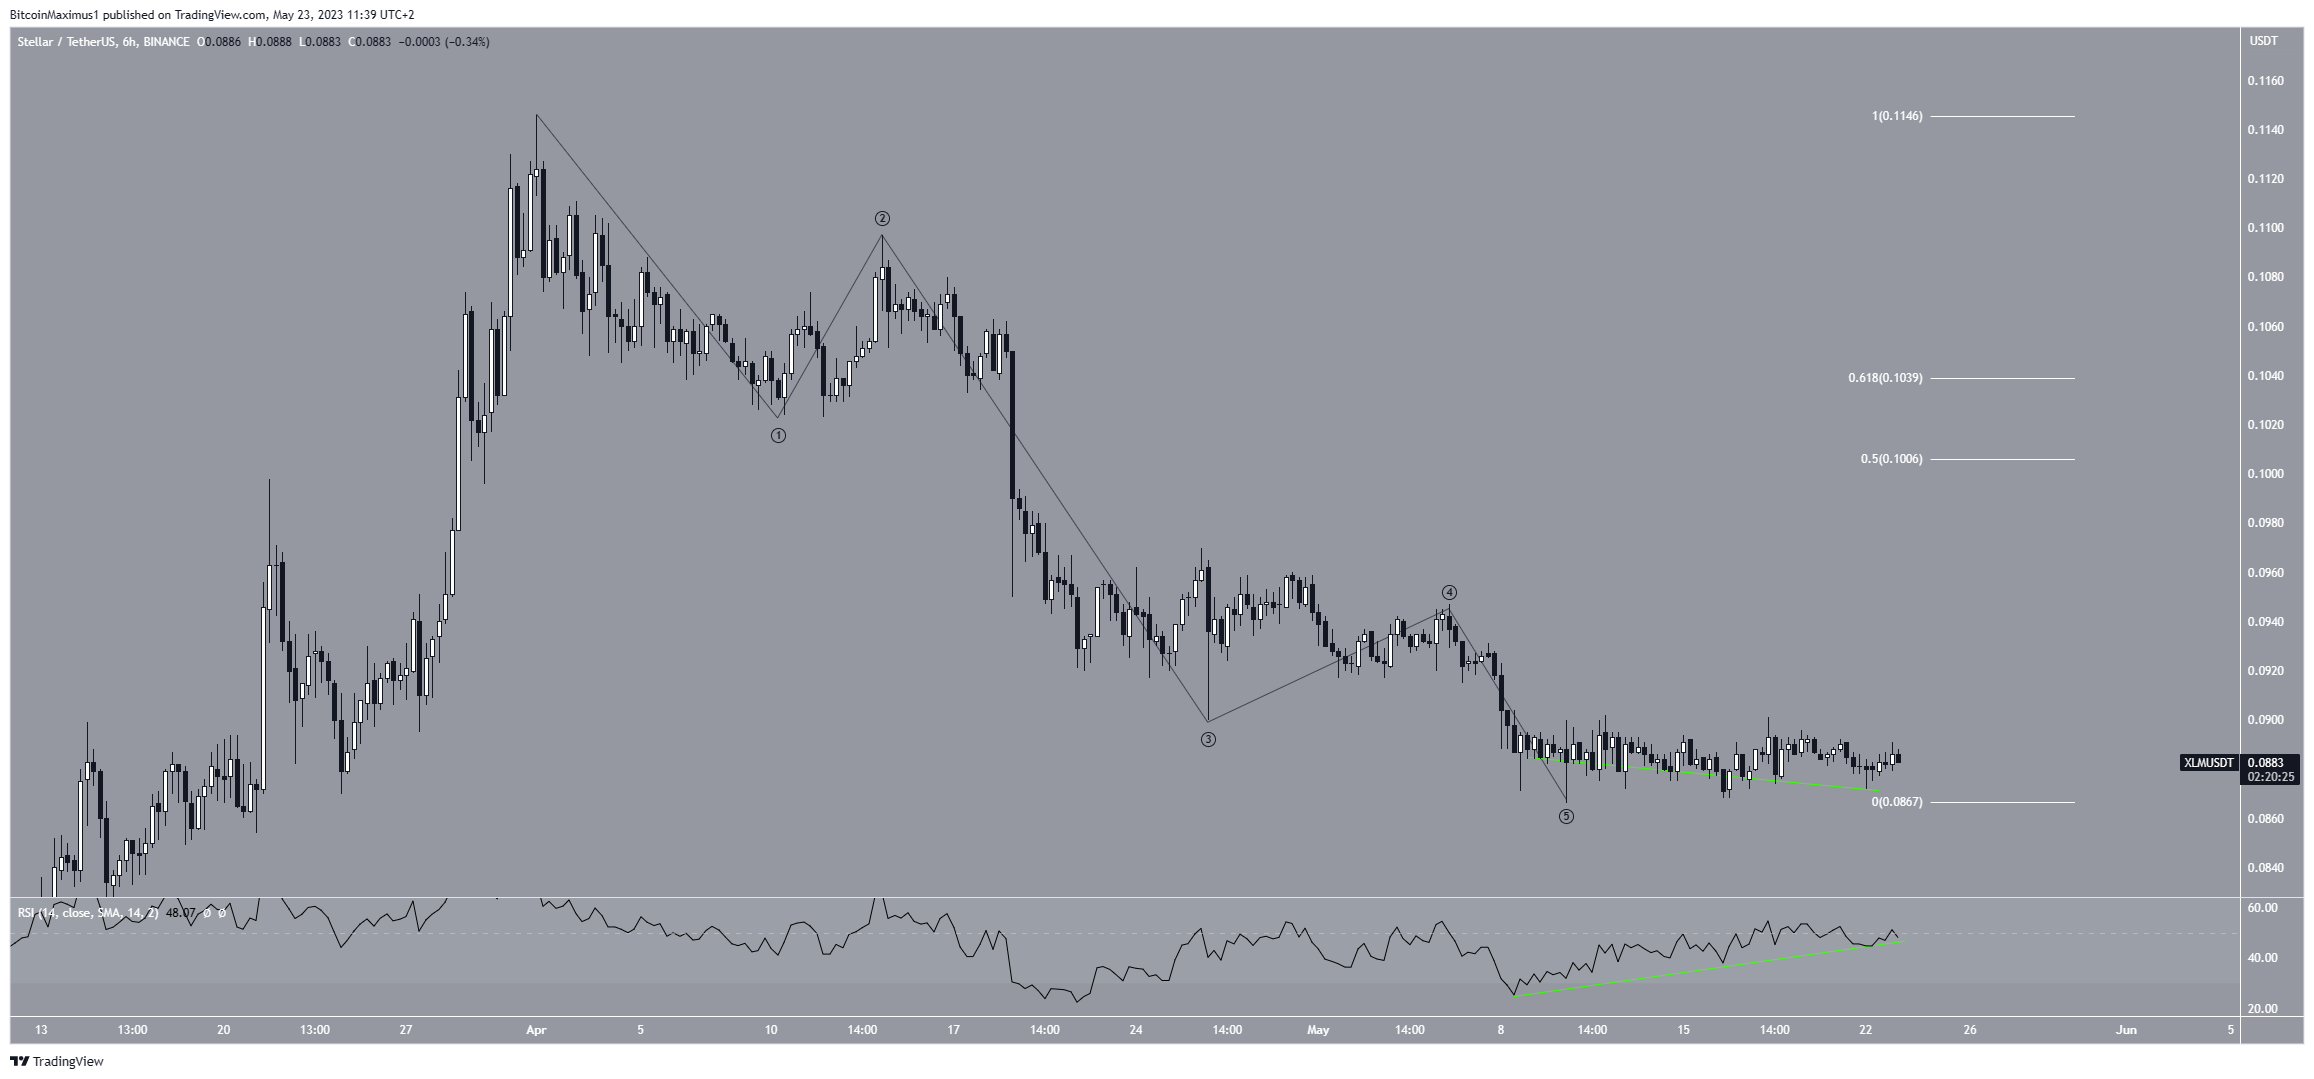
However, this bullish XLM price prediction will be invalidated if the price closes below $0.088.
A drop to the $0.080 support area will likely transpire in that case.
For BeInCrypto’s latest crypto market analysis, click here.
The post Is Stellar (XLM) Price Set for a Bounce Despite Fragile Outlook? appeared first on BeInCrypto.


