


Litecoin price started a fresh decline from well above $200 against the US Dollar. LTC price is now trading below $200 and the 55 simple moving average (4-hours). There was a break below a crucial contracting triangle with support near $192 on the 4-hours chart of the LTC/USD pair (data feed from Coinbase). The pair […]
- Litecoin price started a fresh decline from well above $200 against the US Dollar.
- LTC price is now trading below $200 and the 55 simple moving average (4-hours).
- There was a break below a crucial contracting triangle with support near $192 on the 4-hours chart of the LTC/USD pair (data feed from Coinbase).
- The pair could continue to decline unless there is a clear break above the $192 resistance.
Litecoin price is moving lower and trading below $200 against the US Dollar, similar to bitcoin. LTC price could decline heavily if there is a break below $172.
Litecoin Price Analysis
This week, there was a fresh decline in bitcoin, ethereum, ripple, and litecoin against the US Dollar. Earlier, LTC was able to clear the $200 resistance zone to move into a positive zone.
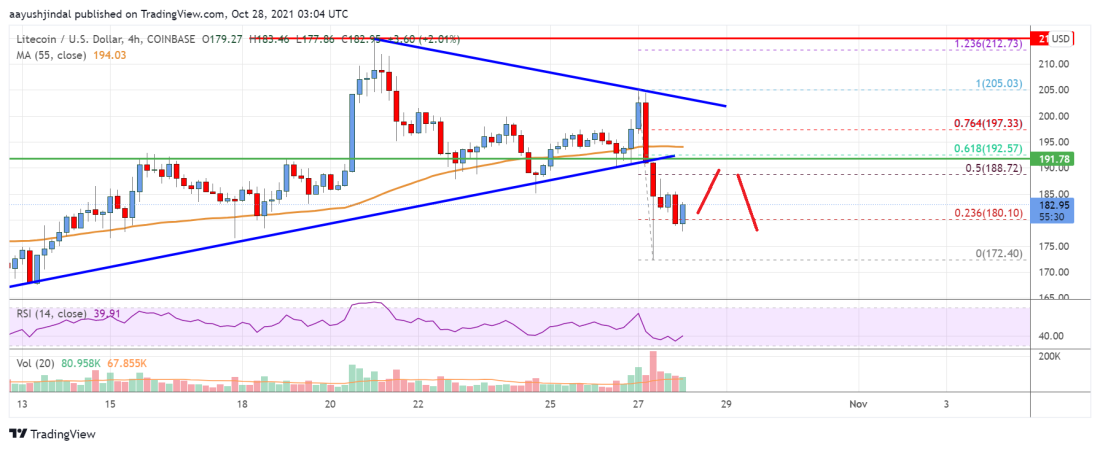
The price even traded above the $205 level. However, the price failed to clear the $212 level and started a fresh decline. There was a break below the $200 support level and the 55 simple moving average (4-hours). There was also break below a crucial contracting triangle with support near $192 on the 4-hours chart of the LTC/USD pair.
A low is formed near $172 and the price is now consolidating losses. It tested the 23.6% Fib retracement level of the recent decline from the $205 swing high to $172 low.
An immediate resistance is near the $185 level. The next key resistance could be $188. It is near the 50% Fib retracement level of the recent decline from the $205 swing high to $172 low. A close above the $188 and $192 levels could open the doors for a decent increase.
In the stated case, the price could rise towards the $212 barrier in the near term. On the downside, an immediate support is near the $175 level. The first key support is near the $172 level.
If there is a downside break the $172 support, the price could decline towards the $165 level. The next key support is near the $160 level.

Litecoin (LTC) Price
Looking at the chart, litecoin price is clearly trading below $200 and the 55 simple moving average (4-hours). Overall, the price could continue to decline unless there is a clear break above the $192 resistance.
Technical indicators
4 hours MACD – The MACD for LTC/USD is now gaining pace in the bearish zone.
4 hours RSI (Relative Strength Index) – The RSI for LTC/USD is now below the 50 level.
Key Support Levels – $172 and $165
Key Resistance Levels – $188 and $192.
The post Litecoin (LTC) Price Analysis: Risk of More Downsides Below $172 appeared first on Live Bitcoin News.


