


Ripple price started a fresh decline from the $1.15 resistance against the US dollar. The price is now trading below $1.08 and the 55 simple moving average (4-hours). There is a key bullish trend line forming with support near $1.070 on the 4-hours chart of the XRP/USD pair (data source from Bittrex). The pair could […]
- Ripple price started a fresh decline from the $1.15 resistance against the US dollar.
- The price is now trading below $1.08 and the 55 simple moving average (4-hours).
- There is a key bullish trend line forming with support near $1.070 on the 4-hours chart of the XRP/USD pair (data source from Bittrex).
- The pair could continue to move down if there is a clear break below $1.05.
Ripple price is showing bearish signs below $1.10 against the US Dollar, unlike bitcoin. XRP price must clear $1.15 for a fresh increase in the near term.
Ripple Price Analysis
After a downside spike below $1.00, ripple price started a fresh increase against the US Dollar. The XRP/USD pair broke the $1.05 and $1.10 resistance levels to move into a positive zone.
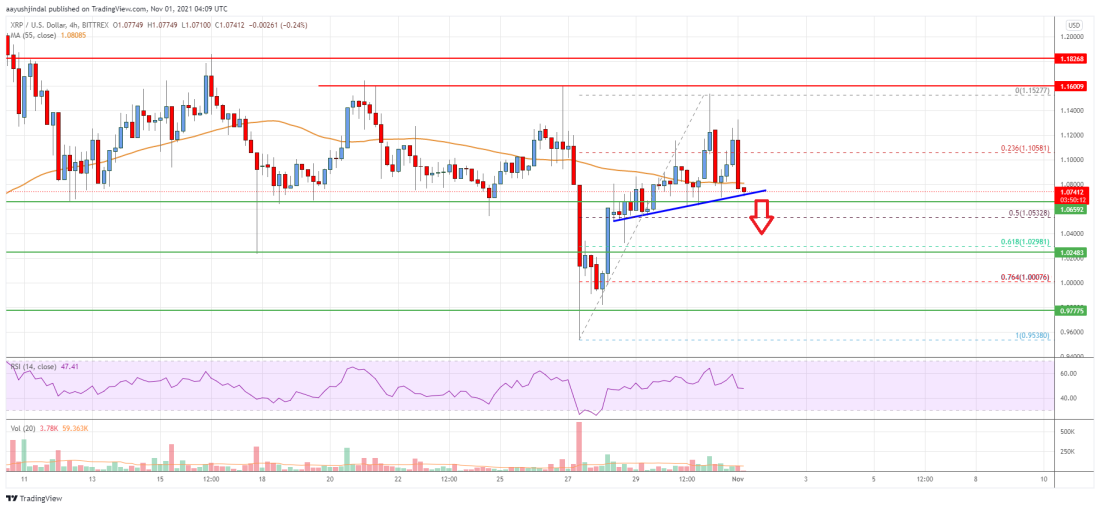
The pair even surpassed the $1.120 resistance and the 55 simple moving average (4-hours). However, the price failed to gain strength for a move above the $1.15 level. A high was formed near $1.152 before there was a fresh decline.
There was a break above the 23.6% Fib retracement level of the upward move from the $0.9538 swing low to $1.152 swing high. The price is now trading below $1.08 and the 55 simple moving average (4-hours).
On the downside, an initial support is near the $1.072 level. There is also a key bullish trend line forming with support near $1.070 on the 4-hours chart of the XRP/USD pair. The first major support is near the $1.052 level. It is close to the 50% Fib retracement level of the upward move from the $0.9538 swing low to $1.152 swing high.
Any more losses could lead the price towards the $1.00 level in the near term. On the upside, XRP is facing resistance near the $1.08 level and the 55 simple moving average (4-hours).
The next key resistance is near the $1.12. A close above the $1.12 could increase the chances of a break above the key $1.15 resistance zone. The next major resistance is near the $1.20 level. Any more gains could lead the price towards the $1.30 level.

Ripple Price
Looking at the chart, ripple price is now trading below $1.08 and the 55 simple moving average (4-hours). Overall, the price could continue to move down if there is a clear break below $1.05.
Technical indicators
4 hours MACD – The MACD for XRP/USD is now gaining momentum in the bearish zone.
4 hours RSI (Relative Strength Index) – The RSI for XRP/USD is now below the 50 level.
Key Support Levels – $1.072, $1.05 and $1.00.
Key Resistance Levels – $1.12 and $1.20.
The post Ripple Price Analysis: Risk of Drop Below $1.05 appeared first on Live Bitcoin News.


