


The Polygon (MATIC) price has reached a critical confluence of resistance levels between $1.25-$1.33. The reaction to it could determine the future trend. The Polygon Network is a scaling solution for the Ethereum blockchain, specializing in smart contracts. Its native token is MATIC. The weekly time frame shows that the MATIC price deviated above the […]
The Polygon (MATIC) price has reached a critical confluence of resistance levels between $1.25-$1.33. The reaction to it could determine the future trend.
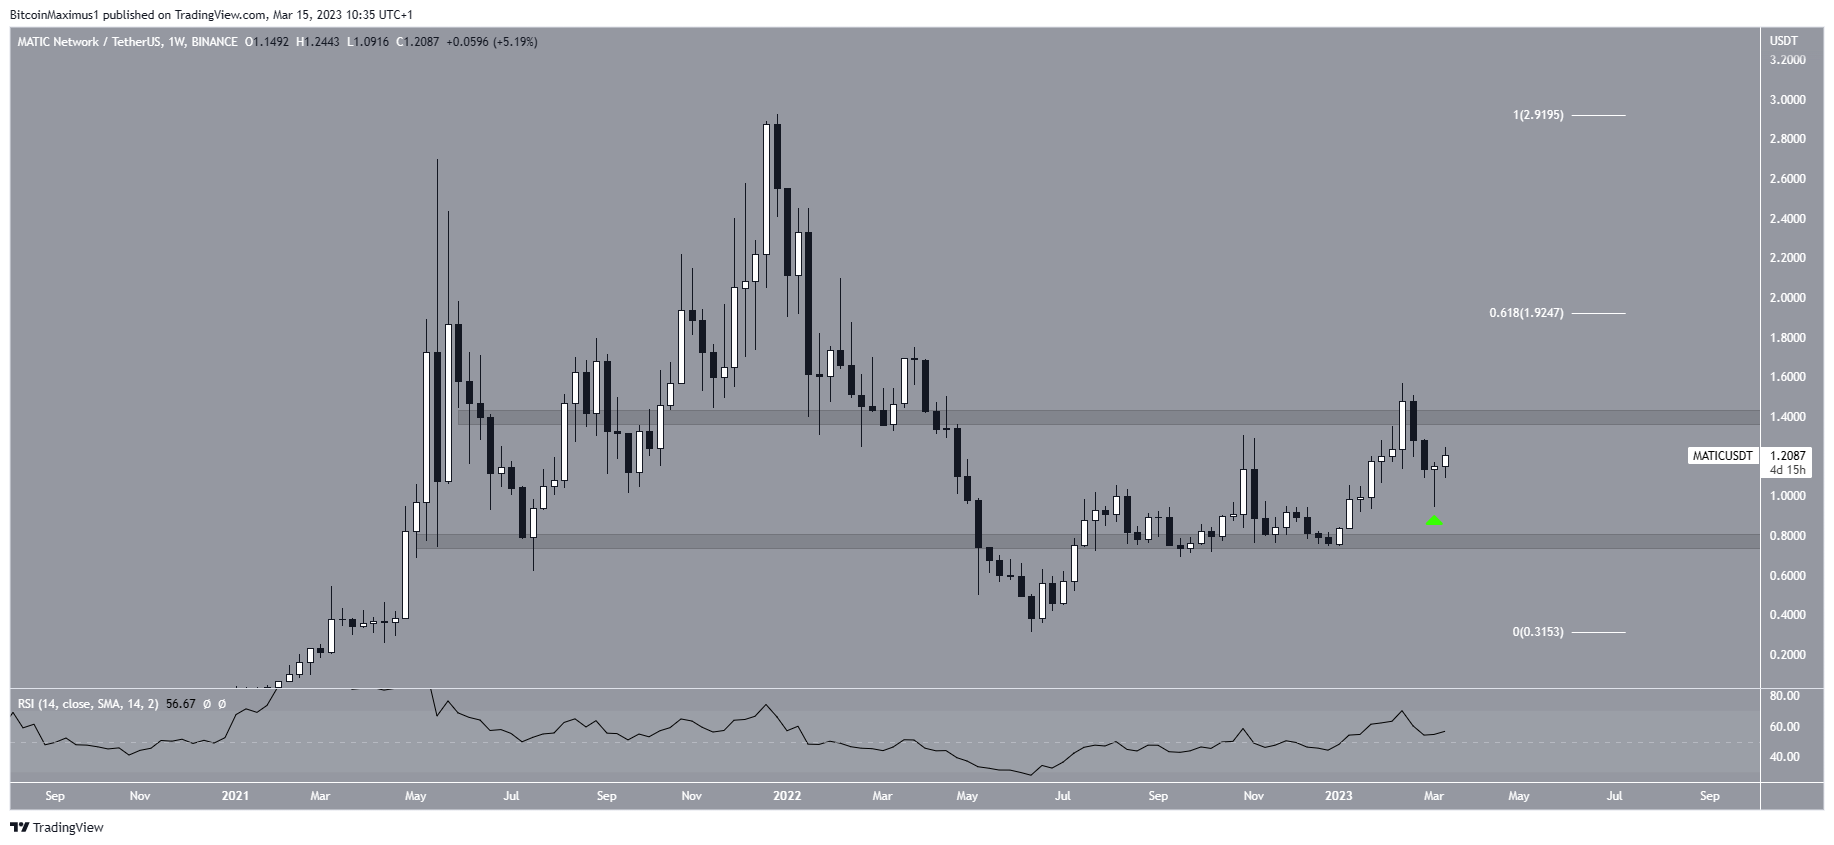
The Polygon Network is a scaling solution for the Ethereum blockchain, specializing in smart contracts. Its native token is MATIC. The weekly time frame shows that the MATIC price deviated above the $1.40 horizontal resistance area in February and fell shortly afterward. However, the price created a bullish candlestick last week, characterized by a long lower wick (green icon), ending the fall.
The price could be making another attempt at reaching the $1.40 resistance area. This is supported by the weekly RSI, which is increasing and is above 50.
However, if the rally loses strength, the Polygon price could fall back to the $0.80 horizontal support area.
Has Polygon (MATIC) Price Begun a Relief Rally?
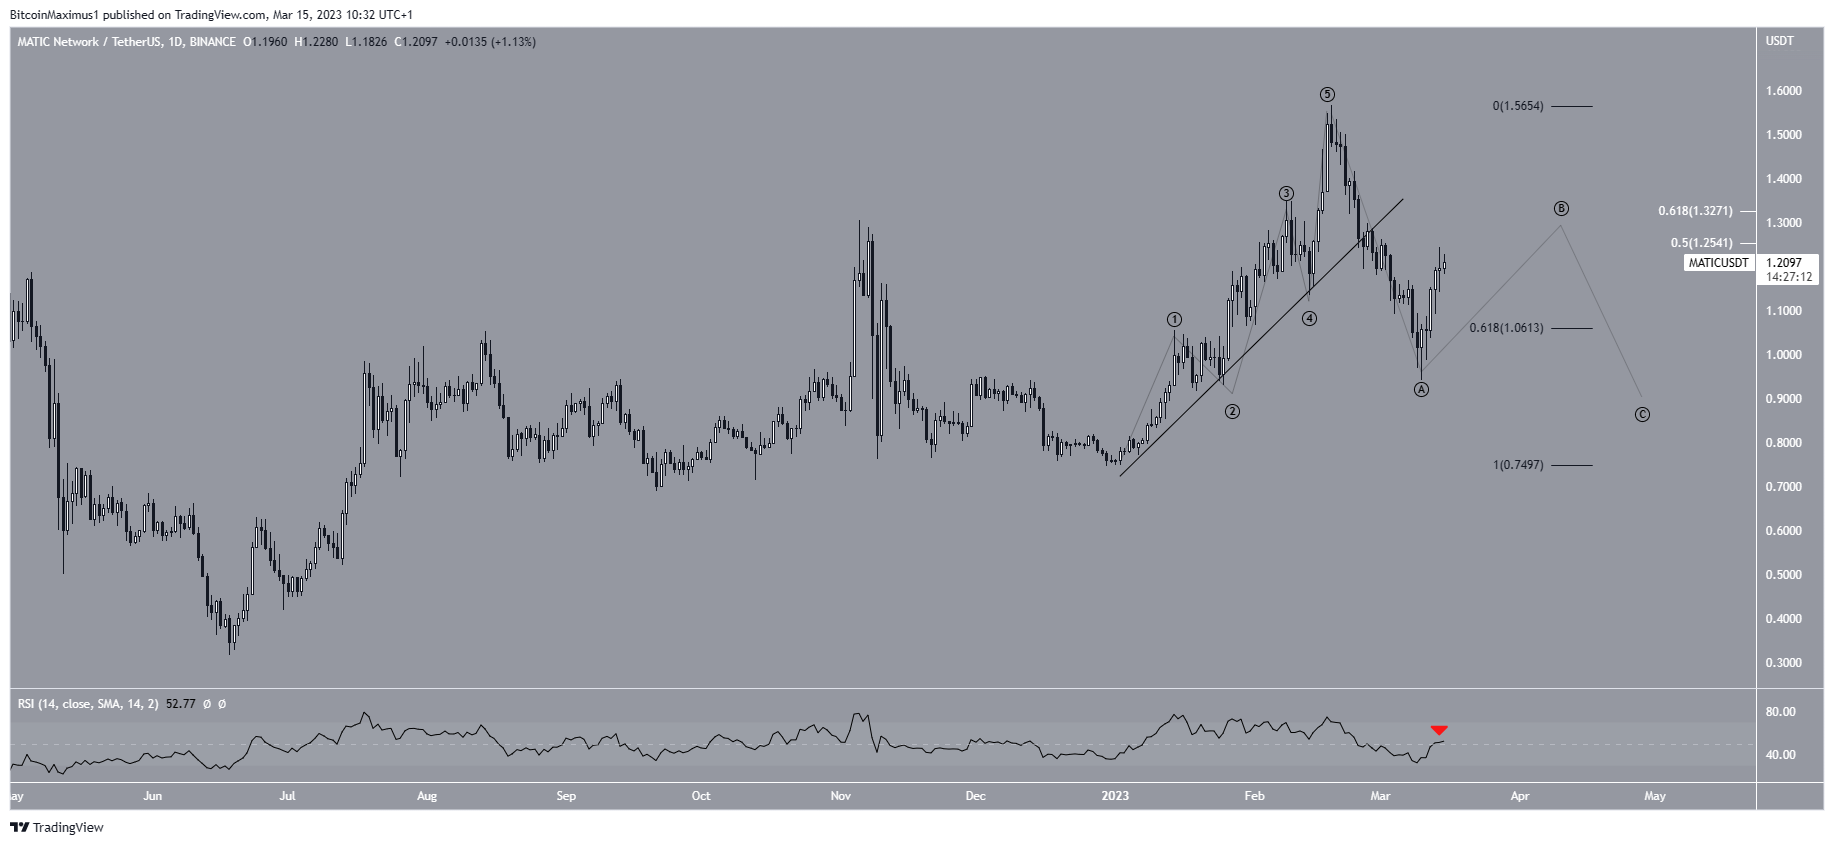
The technical analysis from the daily time frame suggests that the MATIC price is still correcting the previous upward movement. If so, it is currently in a relief rally, after which another decrease will follow.
The MATIC token price seems to have completed a five-wave upward movement (black). It confirmed this with a breakdown from an ascending support line. This led to a low of $0.94 on March 10. Afterward, the price created a bullish hammer candlestick and reclaimed the 0.618 Fib retracement support level at $1.06. This is a bullish sign.
However, the price is now trading close to the 0.5-0.618 Fib retracement resistance (white) levels at $1.25-$1.33. If the increase is indeed a B wave rally, the area could act as a top. Moreover, the daily RSI was rejected by 50 (red icon).
So, the reaction to the $1.25-$1.33 area could determine the future trend’s direction. A rejection from the area would also lead to a RSI rejection. In that case, another downward movement below $1 would be expected. A decisive reaction is likely to occur in the next 24 hours.
However, if the MATIC price manages to break out, it could increase toward $1.93.
To conclude, the direction of the future MATIC price trend is undetermined. Whether the price breaks out or gets rejected from the $1.25-$1.33 area will likely determine if the trend is bullish or bearish. A close above this area could accelerate the increase toward $1.93 while a rejection could lead to a fall toward $0.90.
For BeInCrypto’s latest crypto market analysis, click here.
The post Should You Trust This Polygon (MATIC) Price Rally? appeared first on BeInCrypto.


