


The Solana (SOL) price could break down from the bottom of its range and fall toward the 0.5-0.618 Fib retracement support area. SOL is the native token of the Solana network, created by Anatoly Yakovenko. It uses a unique consensus mechanism which is a combination between a proof-of-stake (PoS) consensus and a proof-of-history (PoH). The […]
The Solana (SOL) price could break down from the bottom of its range and fall toward the 0.5-0.618 Fib retracement support area.
SOL is the native token of the Solana network, created by Anatoly Yakovenko. It uses a unique consensus mechanism which is a combination between a proof-of-stake (PoS) consensus and a proof-of-history (PoH).
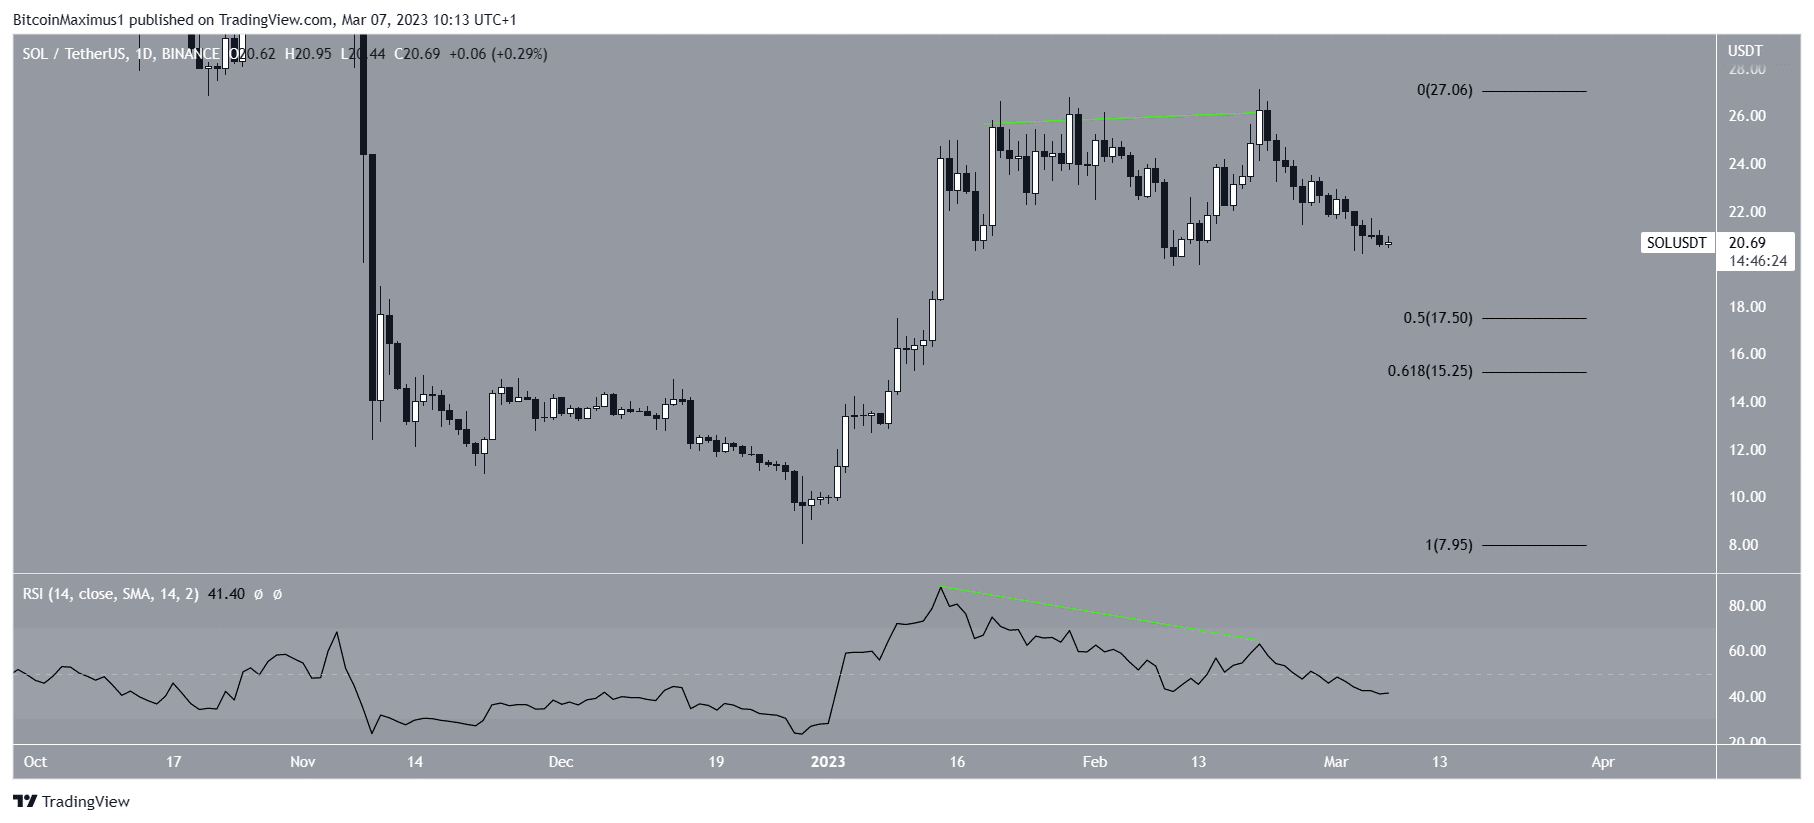
The daily time frame shows that the Solana price created a double top pattern in January and February. The double top is considered a bearish pattern that usually leads to bearish trend reversals. The pattern was combined with bearish divergence in the RSI (green line). This further supports the possibility of a bearish trend reversal. The fact that the RSI is below 50 even further solidifies this.
If the price continues to decrease, the 0.5-0.618 Fib retracement support area could be expected to act as the bottom.
Solana (SOL) Price Struggles at Range Low
The technical analysis from the six-hour time frame shows that the Solana price has traded in a range between $20.80 and $26 since Jan. 14. During this period, it briefly deviated above the top of the range (red circle) before falling to the support of the range under a descending resistance line. The price has been trading inside the support area since the beginning of March.
The daily RSI provides a mixed reading. While the indicator is below 50, a sign of a bearish trend, it has also generated bullish divergence (green line), which often preceded upward movements.
Therefore, whether the SOL token price bounces at $20.80 and breaks out from the resistance line or breaks down from the bottom of the range instead could determine the future trend’s direction. A breakdown could lead to a drop to the 0.5-0.618 Fib retracement support area at $15.36-$17.60. However, a bounce could lead to a retest of the $26 resistance.
Due to the bearish readings from the daily time frame, a breakdown is the most likely scenario.
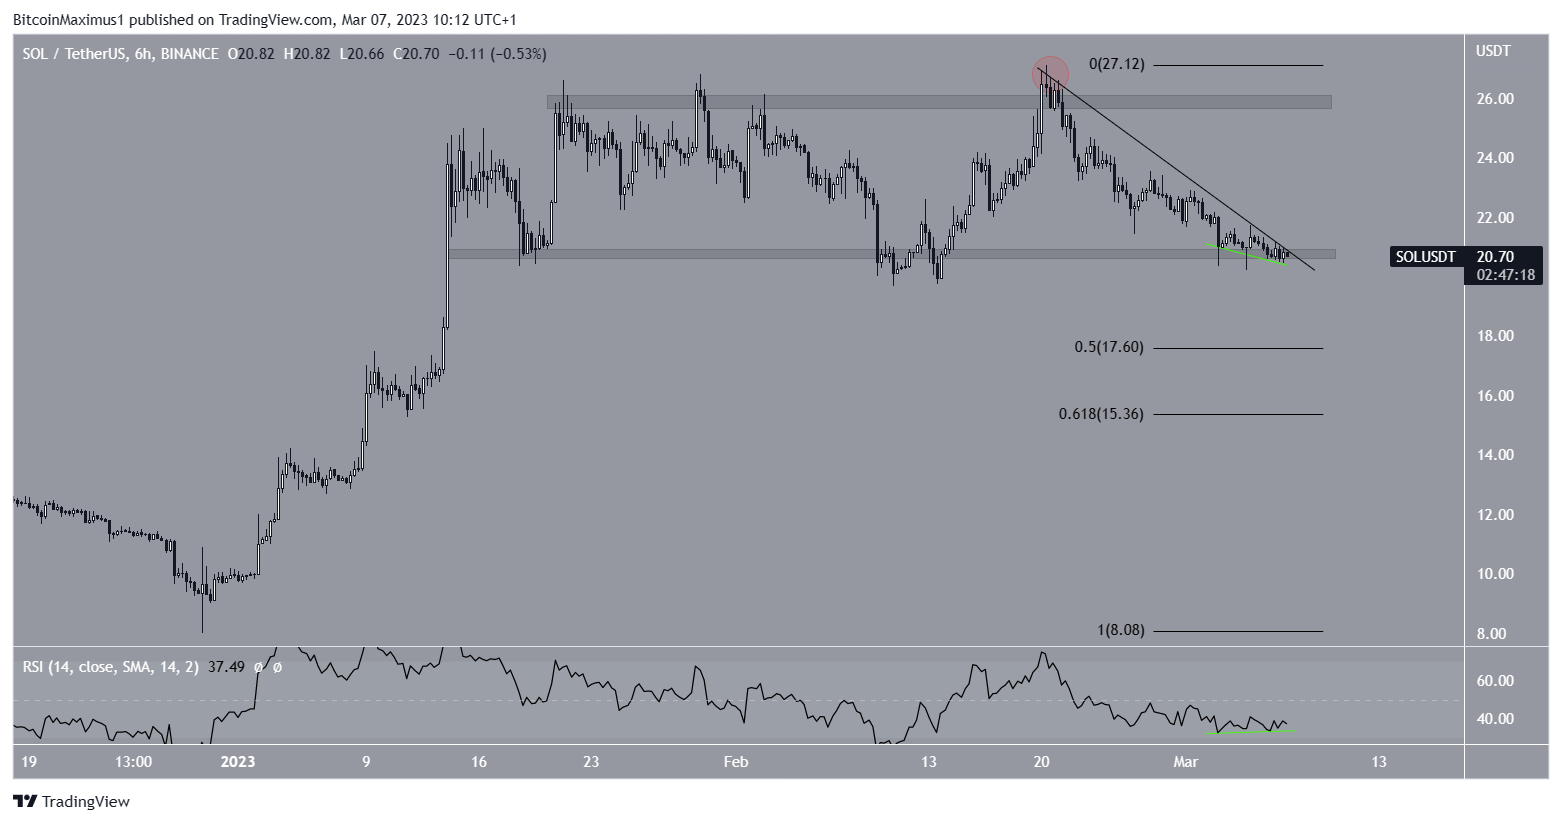
To conclude, the most likely Solana (SOL) price forecast is a breakdown from the $20.80 support area and fall to the 0.5-0.618 Fib retracement support region at $15.36-$17.60. A breakout from the short-term descending resistance line would invalidate this bearish outlook. In that case, the SOL price could increase to the top of the range at $26.
For BeInCrypto’s latest crypto market analysis, click here.
The post Solana (SOL) Price Faces Further Dips Before Correction Is Over appeared first on BeInCrypto.


