


Stellar lumen price is struggling to stay above $0.3650 against the US Dollar. XLM price is now trading below $0.3800 and the 55 simple moving average (4-hours). There is a key bearish trend line forming with resistance near $0.3800 on the 4-hours chart (data feed via Kraken). The pair could continue to move down if […]
- Stellar lumen price is struggling to stay above $0.3650 against the US Dollar.
- XLM price is now trading below $0.3800 and the 55 simple moving average (4-hours).
- There is a key bearish trend line forming with resistance near $0.3800 on the 4-hours chart (data feed via Kraken).
- The pair could continue to move down if there is a break below the $0.3650 support zone.
Stellar lumen price is trading well above $0.4000 against the US Dollar, similar to bitcoin. XLM price must settle above $0.3800 to start a fresh increase.
Stellar Lumen Price Analysis (XLM to USD)
After forming a base above the $0.3200 level, stellar lumen price started a fresh increase against the US Dollar. The XLM/USD pair broke the $0.3500 barrier to move into a positive zone.
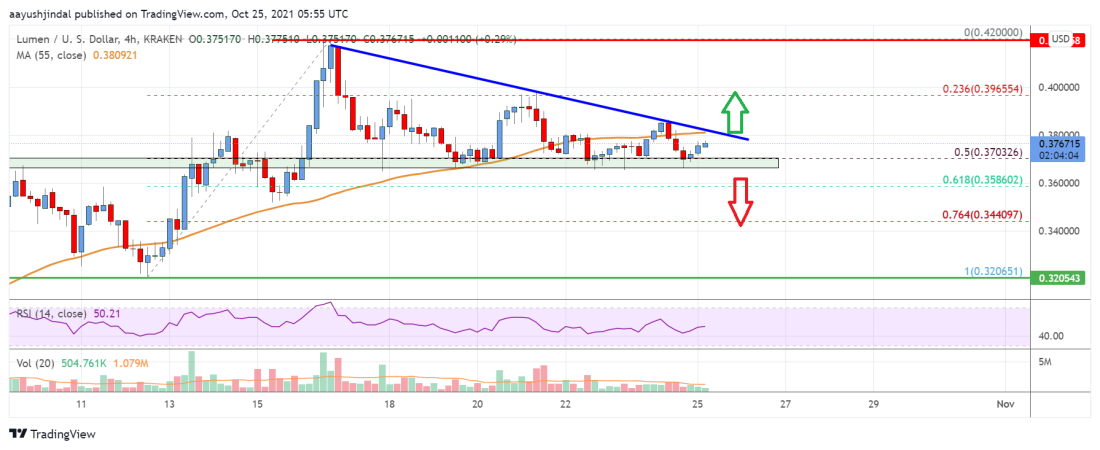
There was also a break above the $0.3650 and $0.3800 resistance levels. Finally, the pair climbed above the $0.4000 resistance level and settled above the 55 simple moving average (4-hours). A high was formed near $0.4200 before there was a downside correction.
The price corrected lower below the $0.3850 level. There was a break below the 23.6% Fibonacci retracement level of the upward wave from the $0.3200 swing low to $0.4200 high.
However, the price remained supported near the $0.3650 level and the 55 simple moving average (4-hours). The pair also found support near the 50% Fibonacci retracement level of the upward wave from the $0.3200 swing low to $0.4200 high.
An immediate hurdle on the upside for the bulls could be $0.3800. There is also a key bearish trend line forming with resistance near $0.3800 on the 4-hours chart.
The first major resistance is now near $0.4000. If there is a clear break above the $0.4000 resistance zone, the price could start another steady increase. The next key resistance is near the $0.4200 level, above which the price could visit $0.4500.
On the downside, there is a decent support forming near the $0.3650 level. The main support is near $0.3500. A downside break below the $0.3500 support might call for more losses. The next major support is near the $0.3200 zone.

Stellar Lumen (XLM) Price
The chart indicates that XLM price is now trading above $0.3800 and the 55 simple moving average (4-hours). Overall, the price could continue to move down if there is a break below the $0.3650 support zone.
Technical Indicators
4 hours MACD – The MACD for XLM/USD is slowly losing momentum in the bullish zone.
4 hours RSI – The RSI for XLM/USD is now above the 50 level.
Key Support Levels – $0.3650 and $0.3500.
Key Resistance Levels – $0.3800, $0.4000 and $0.4200.
The post Stellar Lumen (XLM) Price Remains At Risk of More Downsides appeared first on Live Bitcoin News.


