


These two crypto analysts failed to make accurate predictions for the crypto market in May, particularly regarding the Bitcoin (BTC) price. Forecasting the direction of the cryptocurrency market is difficult because of its considerable fluctuations and sometimes lack of correlation with broader economic trends. These two analysts made predictions about the crypto market in May […]
These two crypto analysts failed to make accurate predictions for the crypto market in May, particularly regarding the Bitcoin (BTC) price.
Forecasting the direction of the cryptocurrency market is difficult because of its considerable fluctuations and sometimes lack of correlation with broader economic trends.
These two analysts made predictions about the crypto market in May that were untrue.
Negentropic’s Bullish Move Does Not Materialize
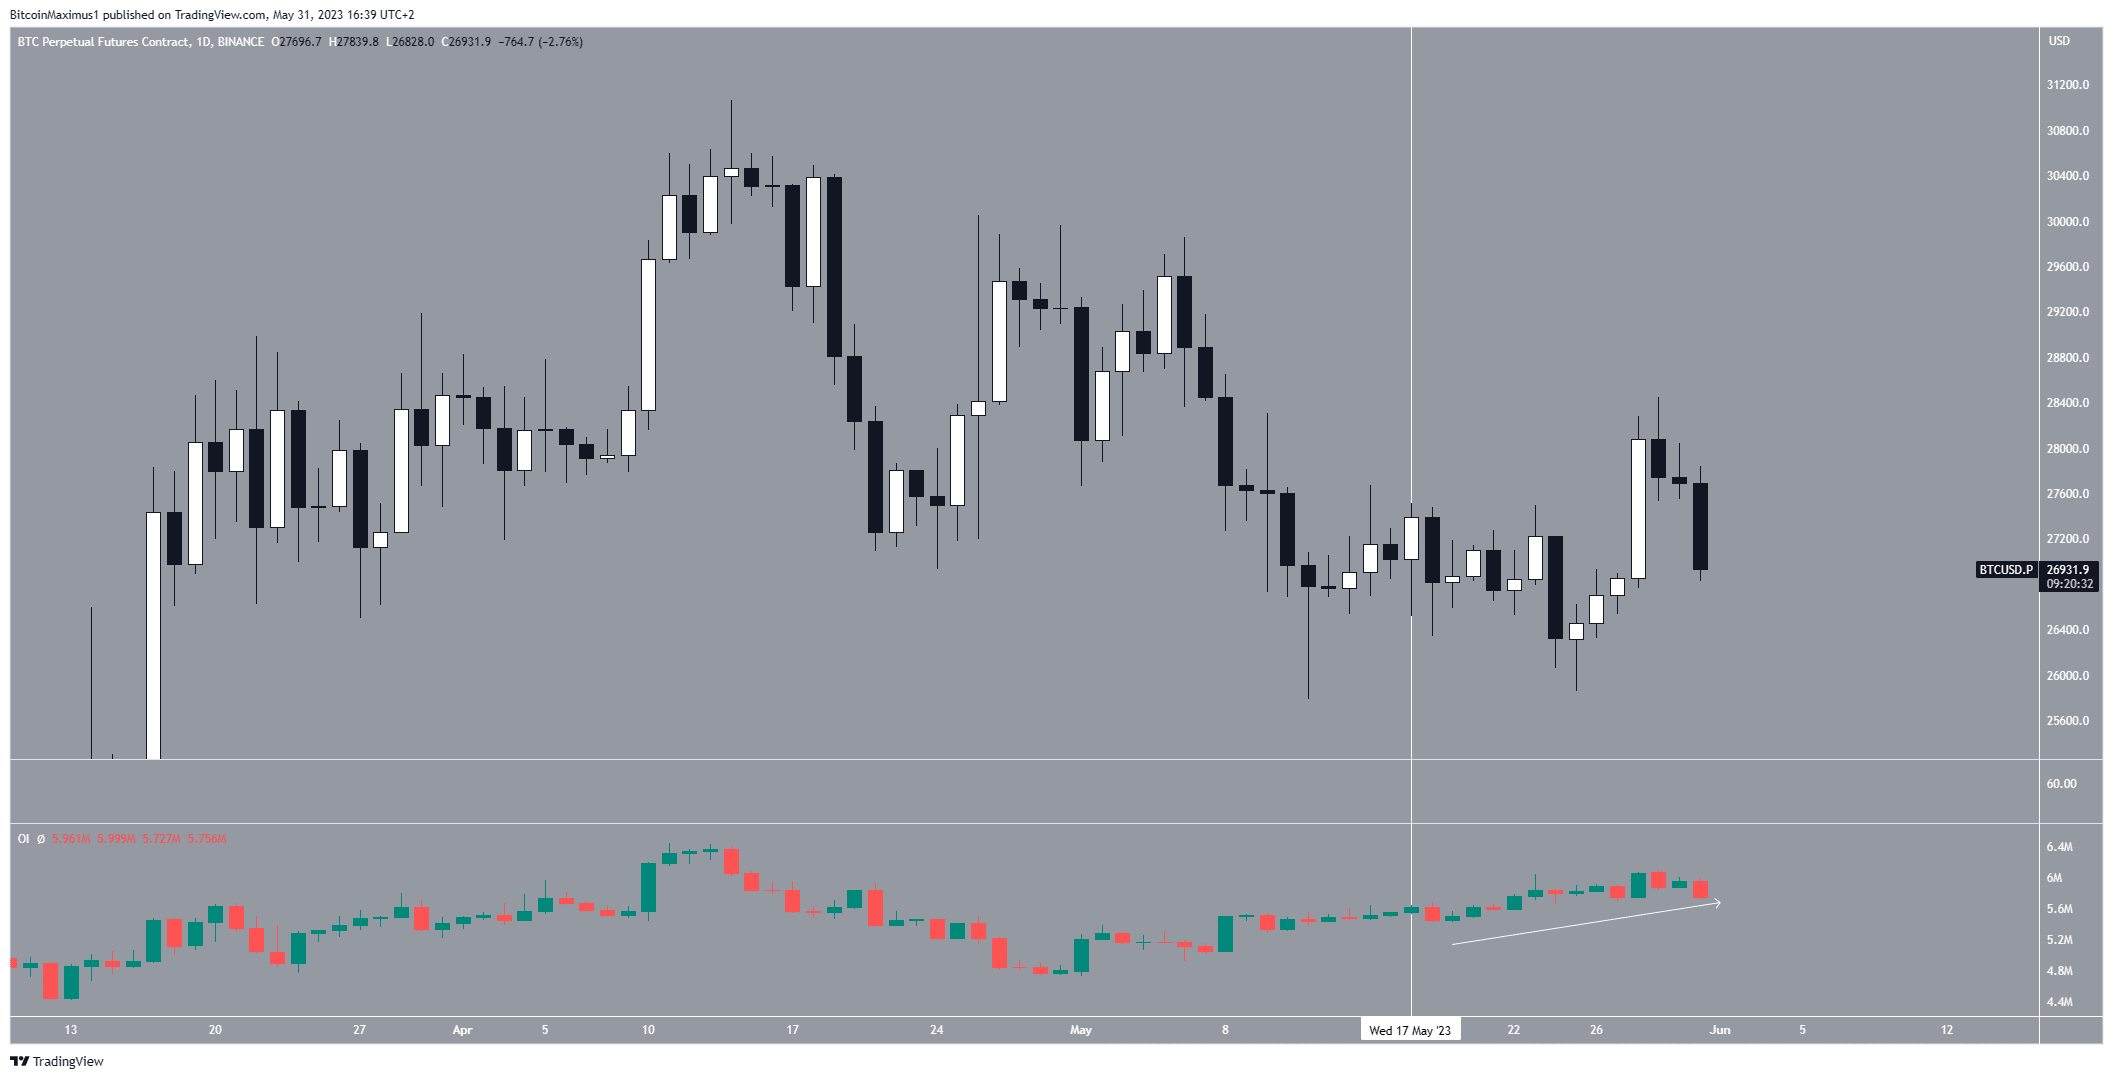
On-chain crypto analyst @Negentropic suggested on May 17 that a bullish movement will soon materialize for the Bitcoin price.
His reasons came from the fact that despite a price fall, the number of shorts decreased simultaneously with an increase in longs. Additionally, open interest was increasing.
An increasing open interest during price consolidation usually leads to a sharp movement in one or the other direction. Due to the decrease in shorts, the idea was that this movement will transpire to the upside.
While the reasons behind the idea are sound, the increase never materialized. On the contrary, a small decrease transpired after the day of the prediction (white line), which was followed by a slight upward movement.
The price is now trading at the same level as it was on May 17. While open interest is still increasing gradually (white arrow), a move has not yet materialized.
TheMoonCarl’s Failed Descending Triangle
Well-known crypto analyst @TheMoonCarl tweeted a chart of a descending triangle pattern in the Bitcoin price chart. The descending triangle is considered a bearish pattern.
While he did not specify a target for it, a movement that travels its entire height would lead to a low of $22,600.
However, the BTC price did not break down from it (red circle). Rather, it created a long lower wick. After another failed breakdown attempt (green circle), the price actually reclaimed the triangle’s support line and moved to its resistance line (red icon).
Nevertheless, the triangle is not invalidated yet. After the rejection from its resistance line, the price has nearly reached the support line once again. So, a breakdown is still possible.
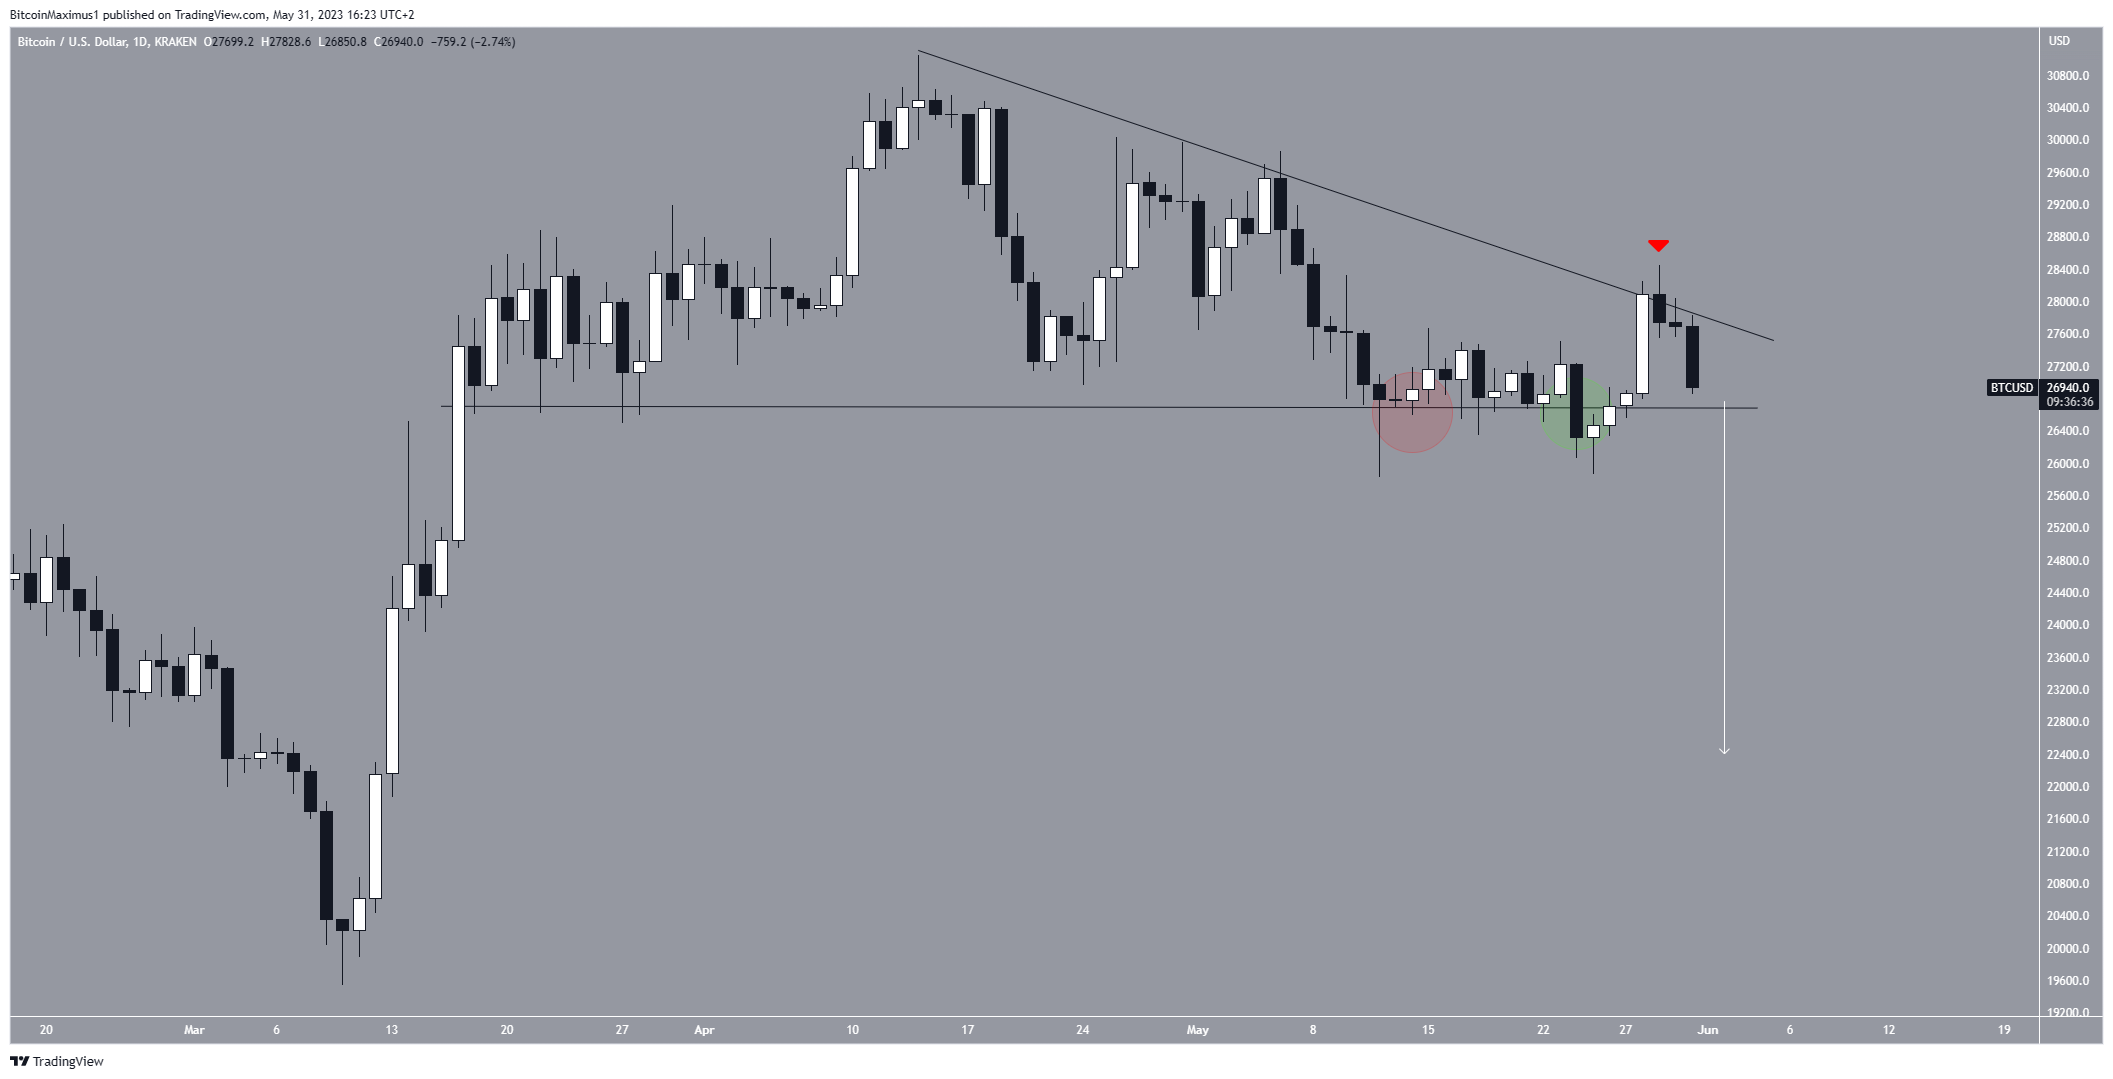
As outlined previously, a breakdown that travels the entire triangle’s height would lead to lows near $22,600. On the other hand, a breakout from the triangle’s resistance line will invalidate the bearish price prediction.
If that happens, it will likely lead to an increase to $29,600.
For BeInCrypto’s latest crypto market analysis, click here.
The post These Crypto Analysts Failed to Time Bitcoin in May 2023 appeared first on BeInCrypto.


