

The Solana (SOL) price has reached long-term horizontal and diagonal support levels. While the weekly timeframe readings are bearish, the daily timeframe shows several bullish signs, indicating that an eventual breakout is likely. Solana Price Returns to Range Low The technical analysis of the weekly time frame shows that the SOL price has fallen since […]
The Solana (SOL) price has reached long-term horizontal and diagonal support levels.
While the weekly timeframe readings are bearish, the daily timeframe shows several bullish signs, indicating that an eventual breakout is likely.
Solana Price Returns to Range Low
The technical analysis of the weekly time frame shows that the SOL price has fallen since its yearly high of $32.13 in July. This week, the price reached the $18 horizontal support area.
This is a critical area since it has provided support since the beginning of the year, except for a deviation (green circle) in June.
The decrease might have accelerated once the bankrupt crypto exchange FTX transferred $10 million in Solana tokens to the Ethereum network.
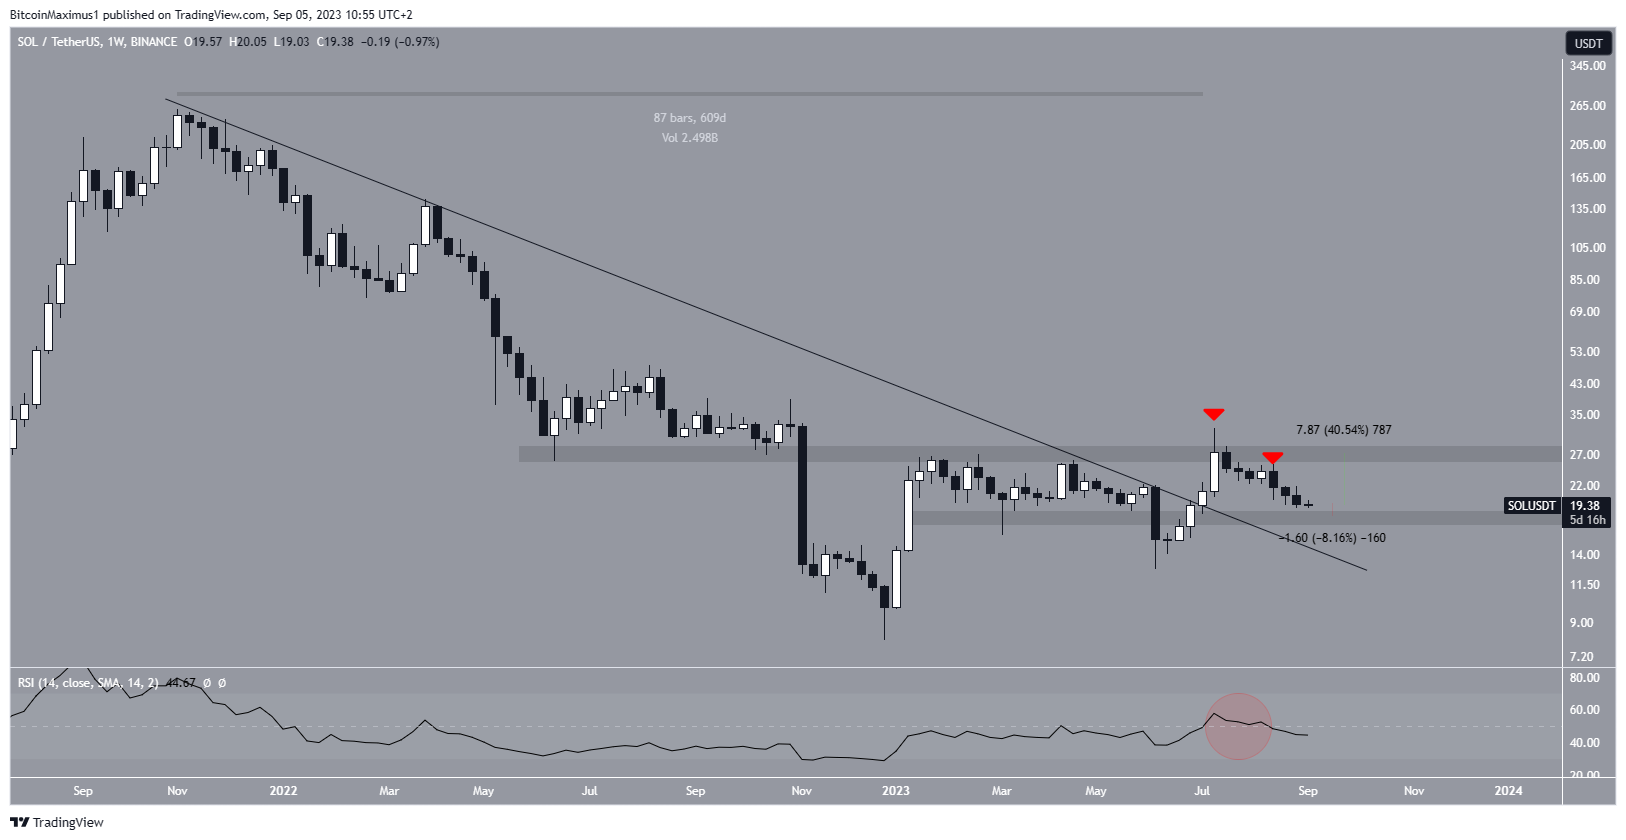
Whether Solana breaks down from the area or bounces will determine the future trend’s direction. A bounce can lead to a 50% increase to the $27 resistance area. On the other hand, a breakdown will likely cause a 30% drop to $13.50.
This would validate a descending resistance line that had been in place since the all-time high in 2021. The SOL price has not validated this line since it broke out in July.
The weekly RSI is bearish. When evaluating market conditions, traders use the RSI as a momentum indicator to determine if a market is overbought or oversold and to decide whether to accumulate or sell an asset.
RSI readings above 50 and an upward trend indicate bullish sentiment, while readings below 50 suggest the opposite. The RSI is currently declining but remains above the 50 mark, resulting in mixed signals and uncertainty about the market trend.
SOL Price Bounces at 256-Day Support Line
The daily timeframe technical analysis gives more hope for a potential bounce. This is because the SOL price has bounced at a 256-day ascending support line. This is the third time the price has bounced at this line (green icons) since the beginning of the year. Each time, significant upward movements have followed.
Furthermore, the SOL price trades inside a descending wedge considered a bullish pattern. The price is very close to breaking out above the wedge’s resistance line.
However, the daily RSI does not support the possibility of a breakout since it is below 50 and decreasing.
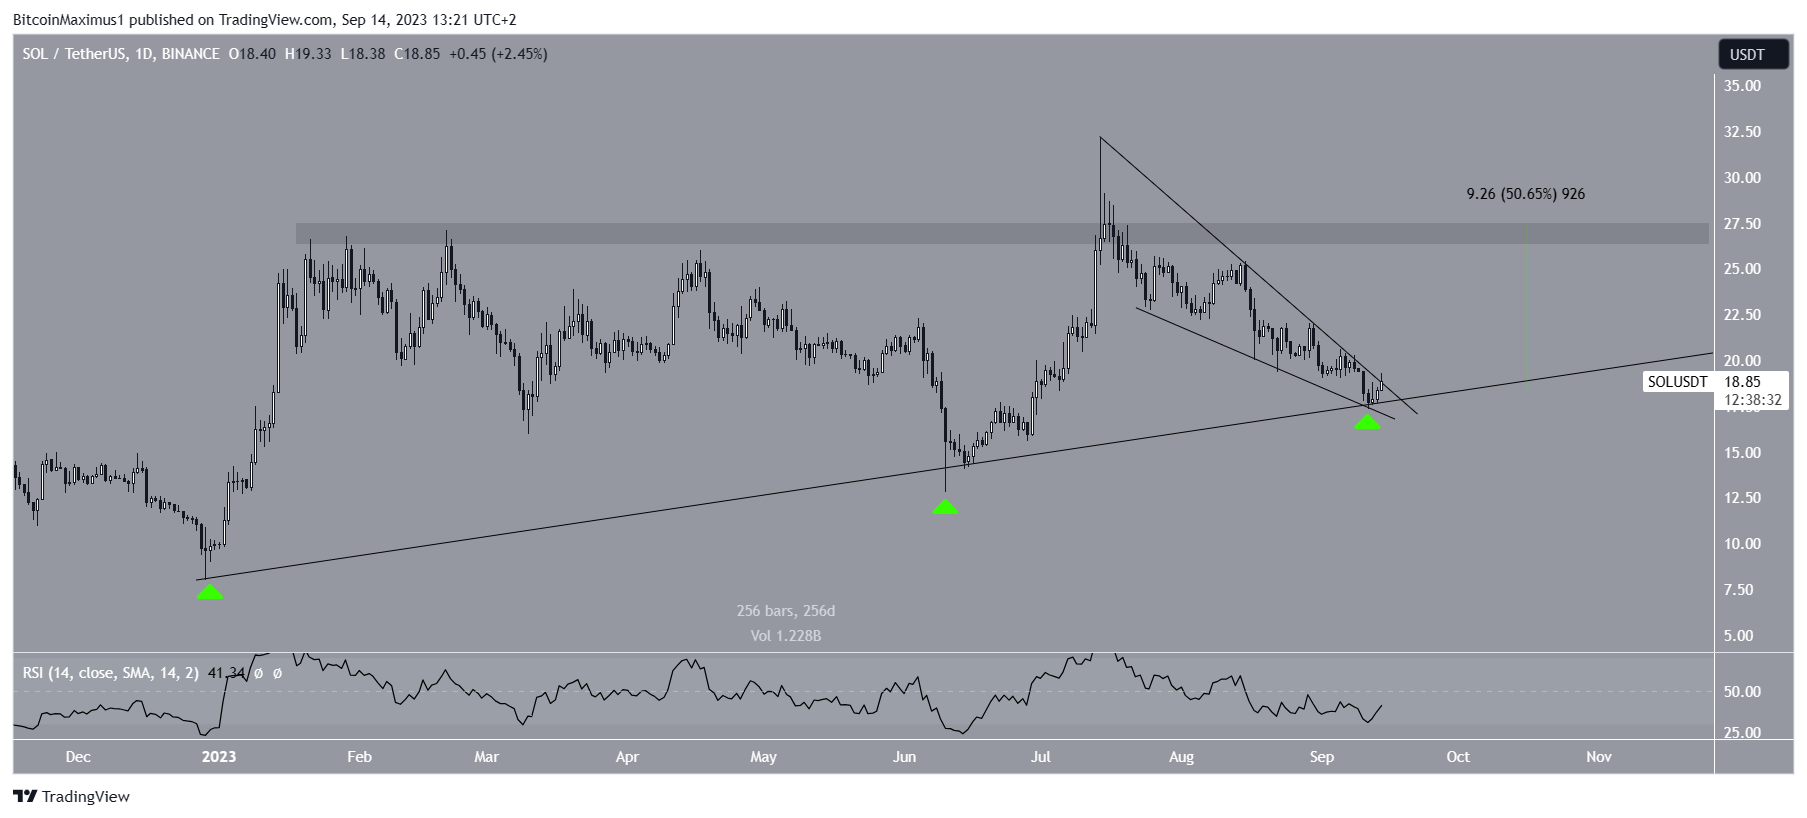
Therefore, the Solana price prediction will depend on whether the price breaks out from the wedge or breaks down from the ascending support line and the $18 horizontal support area. A 50% increase could occur in case of a breakout, while a 30% drop could occur in case of a breakdown.
Check Out the Top 11 Crypto Communities To Join in 2023
For BeInCrypto’s latest crypto market analysis, click here
The post This Solana (SOL) Price Pattern Holds the Key to 50% Increase or 30% Drop appeared first on BeInCrypto.

