


Tron price started a fresh increase above the $0.055 level against the US Dollar. TRX price is now trading above $0.058 and the 55 simple moving average (4-hours). There is a key bullish trend line forming with support near $0.0608 on the 4-hours chart (data feed via Kraken). The pair could continue to move up […]
- Tron price started a fresh increase above the $0.055 level against the US Dollar.
- TRX price is now trading above $0.058 and the 55 simple moving average (4-hours).
- There is a key bullish trend line forming with support near $0.0608 on the 4-hours chart (data feed via Kraken).
- The pair could continue to move up if it breaks the $0.0650 resistance zone.
TRON price started a fresh increase above $0.058 against the US Dollar, similar bitcoin. TRX price could rise further if it clears the $0.060 resistance.
Tron Price Analysis
This past week, tron price started a decent increase from the $0.050 support zone against the US Dollar. TRX price remained well bid and started a decent increase above the $0.055 zone.
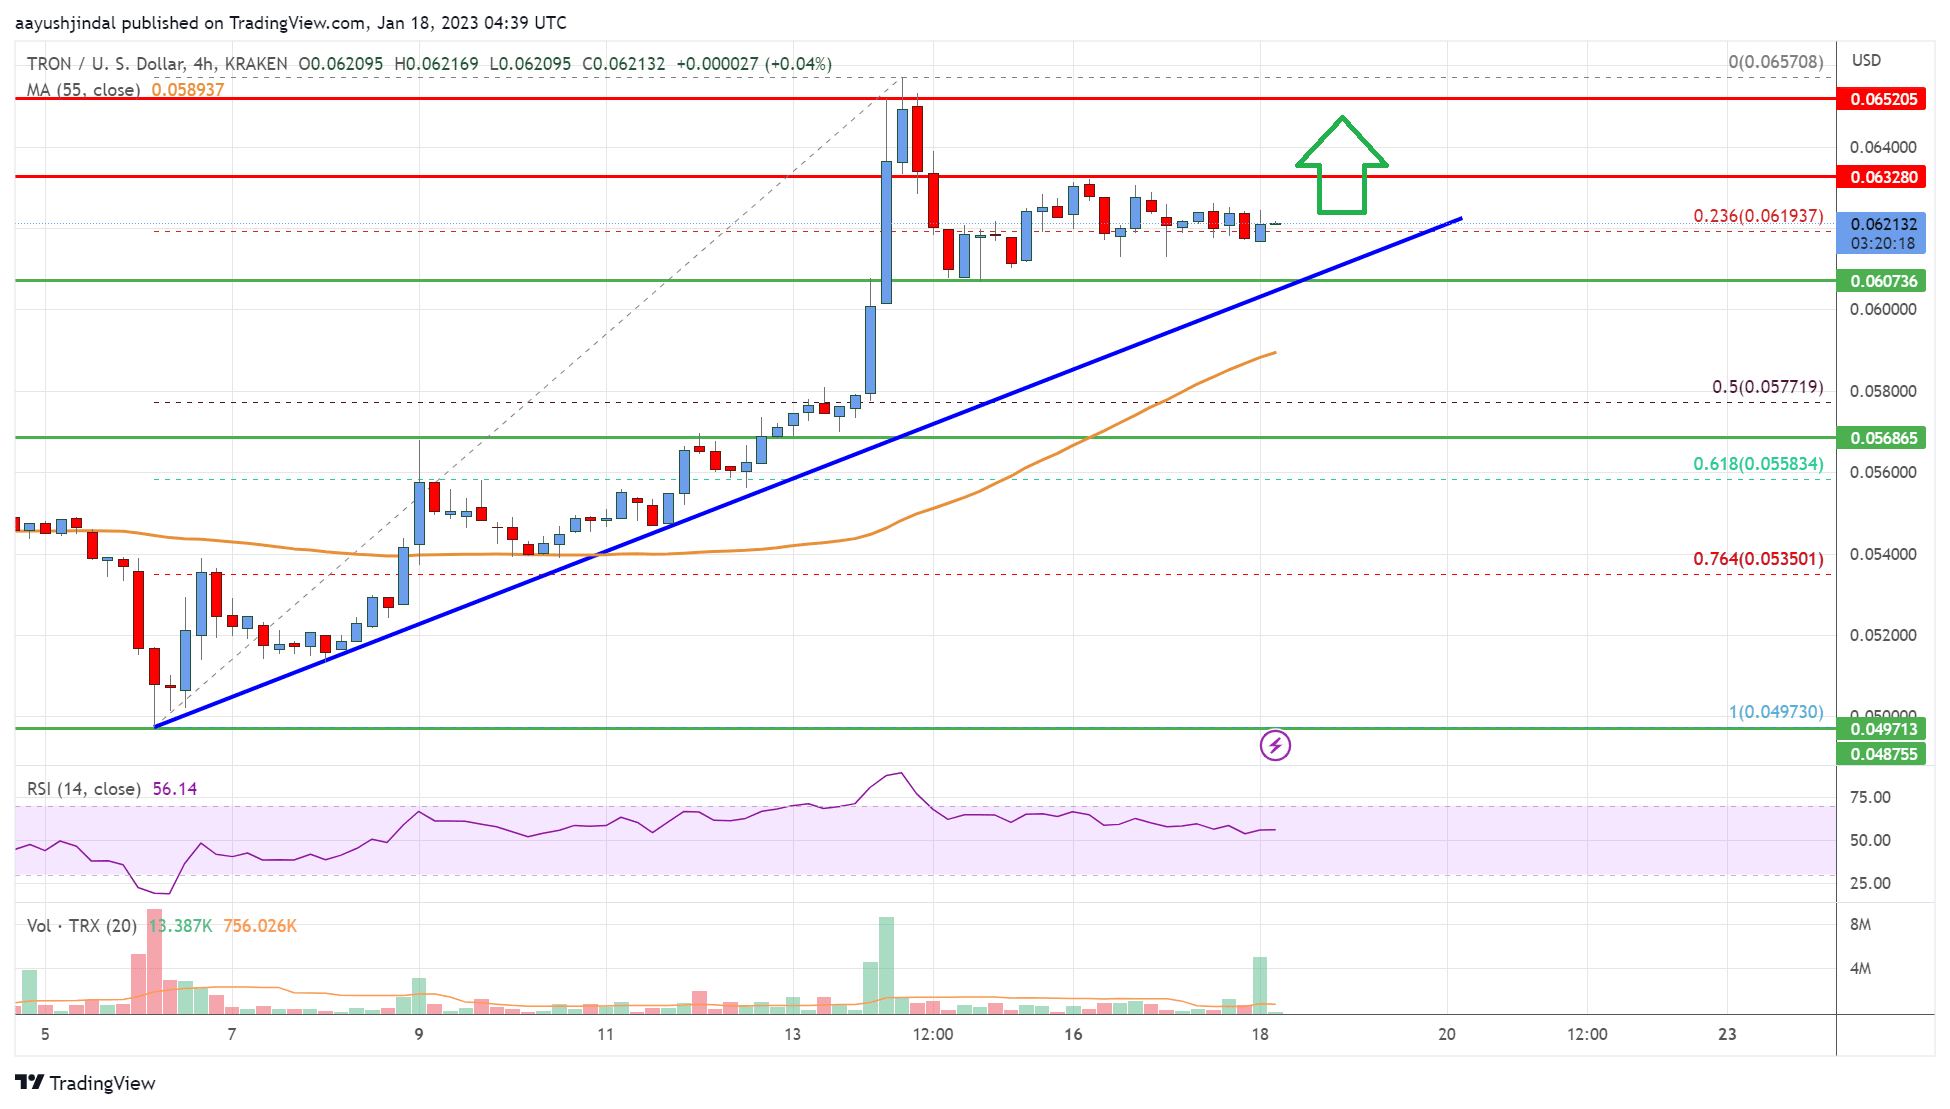
It traded above the $0.0565 and $0.0580 resistance levels to move into a positive zone. The price even surged above the $0.060 resistance zone. The price traded as high as $0.0657 and is currently correcting lower. There was a move below the $0.064 level.
The price declined below the 23.6% Fib retracement level of the upward move from the $0.0497 swing low to $0.0657 high. It is now trading above $0.058 and the 55 simple moving average (4-hours).
On the upside, TRX is facing resistance near the $0.0632 level. The first major resistance is near the $0.0650 level. A close above $0.065 is must for a fresh increase. In the stated case, the price could rise towards the $0.070 resistance in the near term.
Any more gains might send trx price towards $0.075. On the downside, an initial support is near the $0.0612 level. There is also a key bullish trend line forming with support near $0.0608 on the 4-hours chart.
The next major support is now forming near $0.058. It is near the 50% Fib retracement level of the upward move from the $0.0497 swing low to $0.0657 high.
If there is a downside break below the $0.058 support, the price might revisit the $0.0550 support. Any more losses might call for a move towards the $0.0520 zone in the near term.
Tron (TRX) Price
The chart indicates that TRX price is now trading above $0.058 and the 55 simple moving average (4-hours). Overall, the price could continue to move up if it breaks the $0.0650 resistance zone.
Technical Indicators
4 hours MACD – The MACD for TRX/USD is slowly gaining momentum in the bullish zone.
4 hours RSI – The RSI for TRX/USD is above the 50 level.
Key Support Levels – $0.0608 and $0.0580.
Key Resistance Levels – $0.0632, $0.0565 and $0.070.
The post Tron (TRX) Price Analysis: Bulls In Control Above $0.06 appeared first on Live Bitcoin News.


