


The Fetch.ai (FET) price could be nearing the top of its massive upward movement that has seen it soar by 410%. A number of news stories aided the price action. On Jan. 13, Binance announced that it was launching FET/USDT futures on Binance, with up to 20x leverage. And on Jan. 16, the Bitrue exchange […]
The Fetch.ai (FET) price could be nearing the top of its massive upward movement that has seen it soar by 410%.
A number of news stories aided the price action. On Jan. 13, Binance announced that it was launching FET/USDT futures on Binance, with up to 20x leverage. And on Jan. 16, the Bitrue exchange also listed FET on its futures platform.
What’s Behind the FET Price Increase?
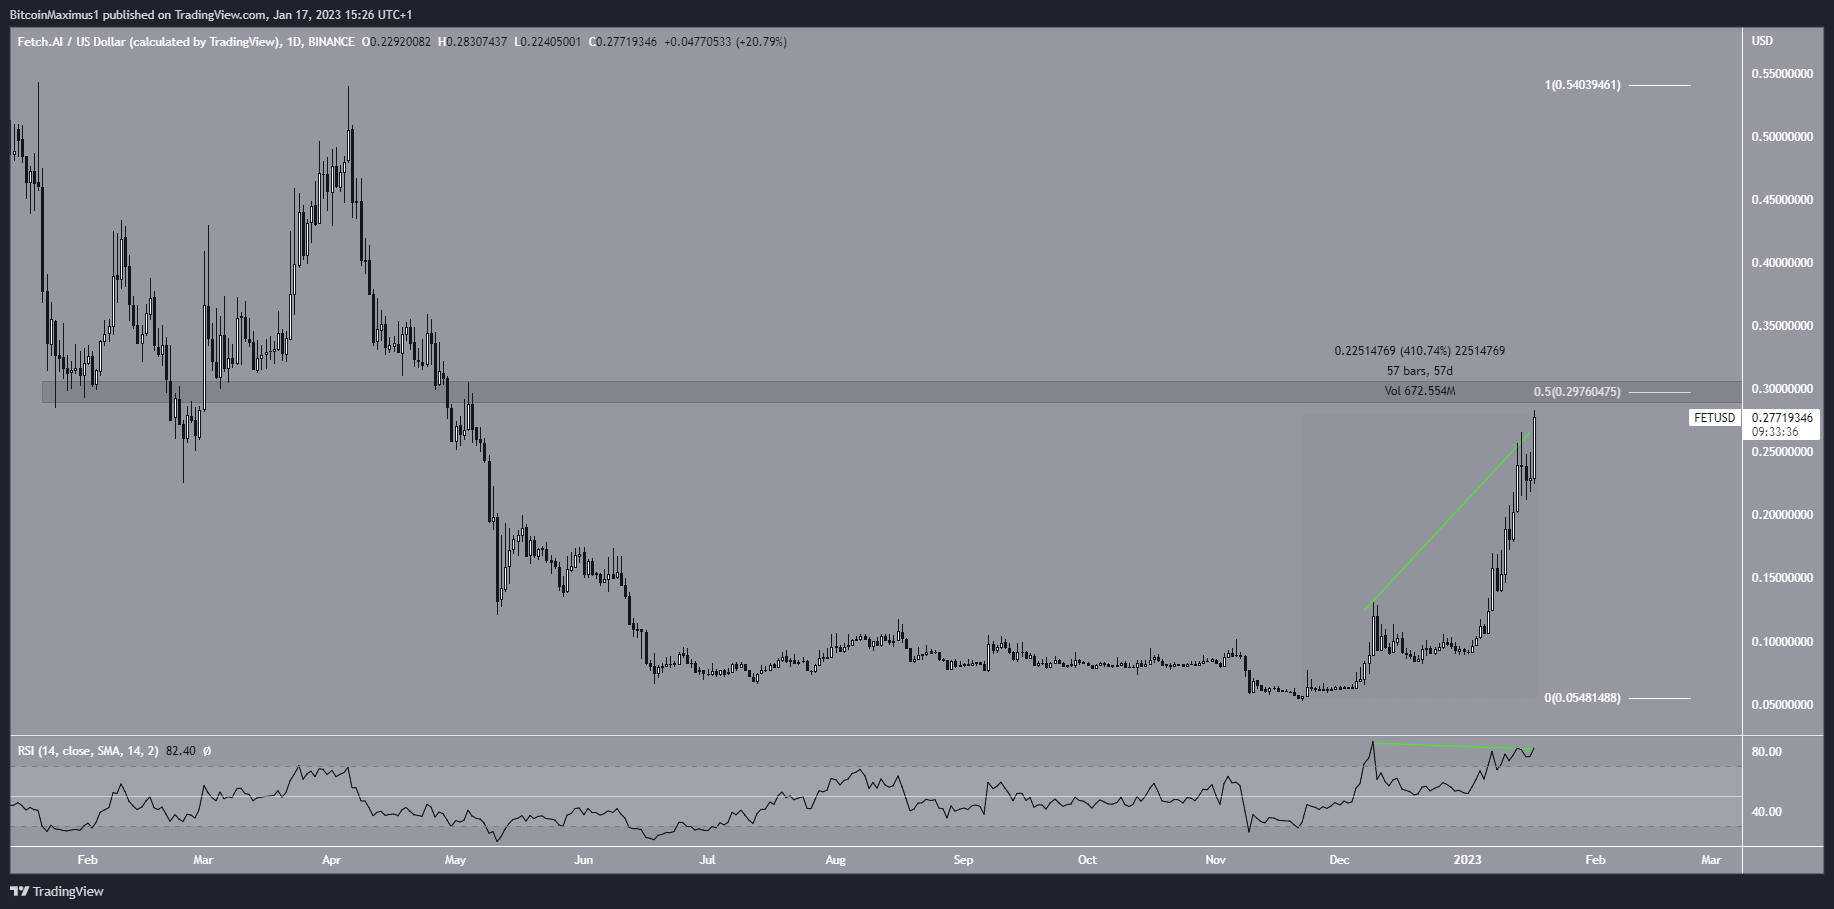
The FET price has increased rapidly since Nov. 22. The upward movement led to a high of $0.28 on Jan. 17, which is an increase of 410% in 57 days. The Fetch.ai price nearly reached the main resistance area at $0.30, which is the 0.5 Fib retracement resistance level of the entire drop. Moreover, it is a horizontal resistance area, increasing its significance. Therefore, a breakout above it could accelerate the rate of increase toward $0.50.
However, the daily RSI warns of an impending drop. This is because the indicator has generated bearish divergence (green line) inside overbought territory. Considerable downward movements often follow such divergences.
As a result, the most likely Fetch.ai price forecast would be a rejection from the resistance area followed by a drop.
Wave Count Warns of Incoming Drop
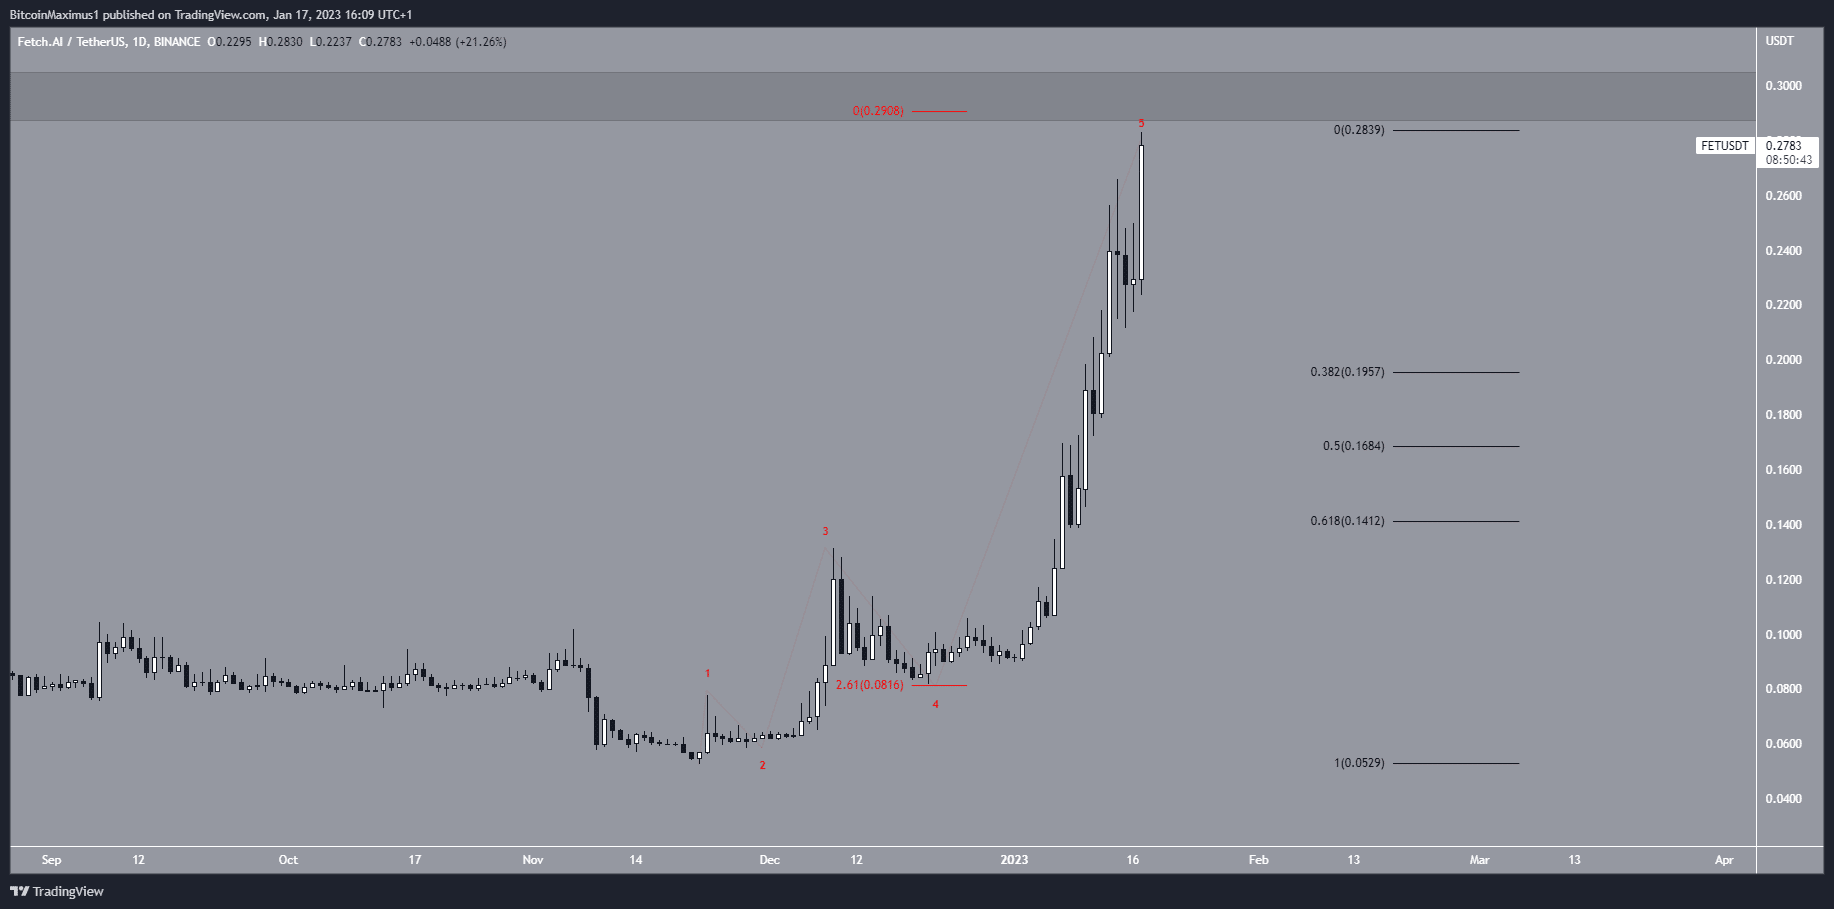
A closer look at the FET token price increase shows that it is in the fifth and final wave of an upward movement (red). Therefore, it could begin a retracement soon. This aligns with the RSI and price action readings from the daily time frame.
Wave five has already extended 2.61 times the length of waves one and three combined. As a result, it is likely nearing its top, after which a considerable retracement is expected.
While the exact values depend on where FET tops, the closest support levels are likely at $0.19 and $0.17, created by the 0.382 and 0.5 Fib retracement support levels, respectively.
As outlined prior, a daily close above the $0.30 resistance area would mean that the trend is still bullish, and the move will extend further.
To conclude, despite positive Fetch.ai news, the most likely price outlook is a rejection at the $0.30 level followed by a downward movement toward $0.19 and $0.17. A daily close above $0.30 would invalidate this bearish outlook.
For BeInCrypto’s latest crypto market analysis, click here.
The post Why Has Fetch.ai (FET) Price Quadrupled This Month? appeared first on BeInCrypto.


